

Question: Activity 1_G: When the confidence level was changed from 95% to 90% (both for x = 260 and n = 750), how did the standard
Activity 1_G:
When the confidence level was changed from 95% to 90% (both for x = 260 and n = 750), how did the standard error and width of the confidence interval change?
Finish the following sentence starters for your answer.
- "When the confidence level decreased, the standard error...
- "When the confidence level decreased, the width of the confidence interval...
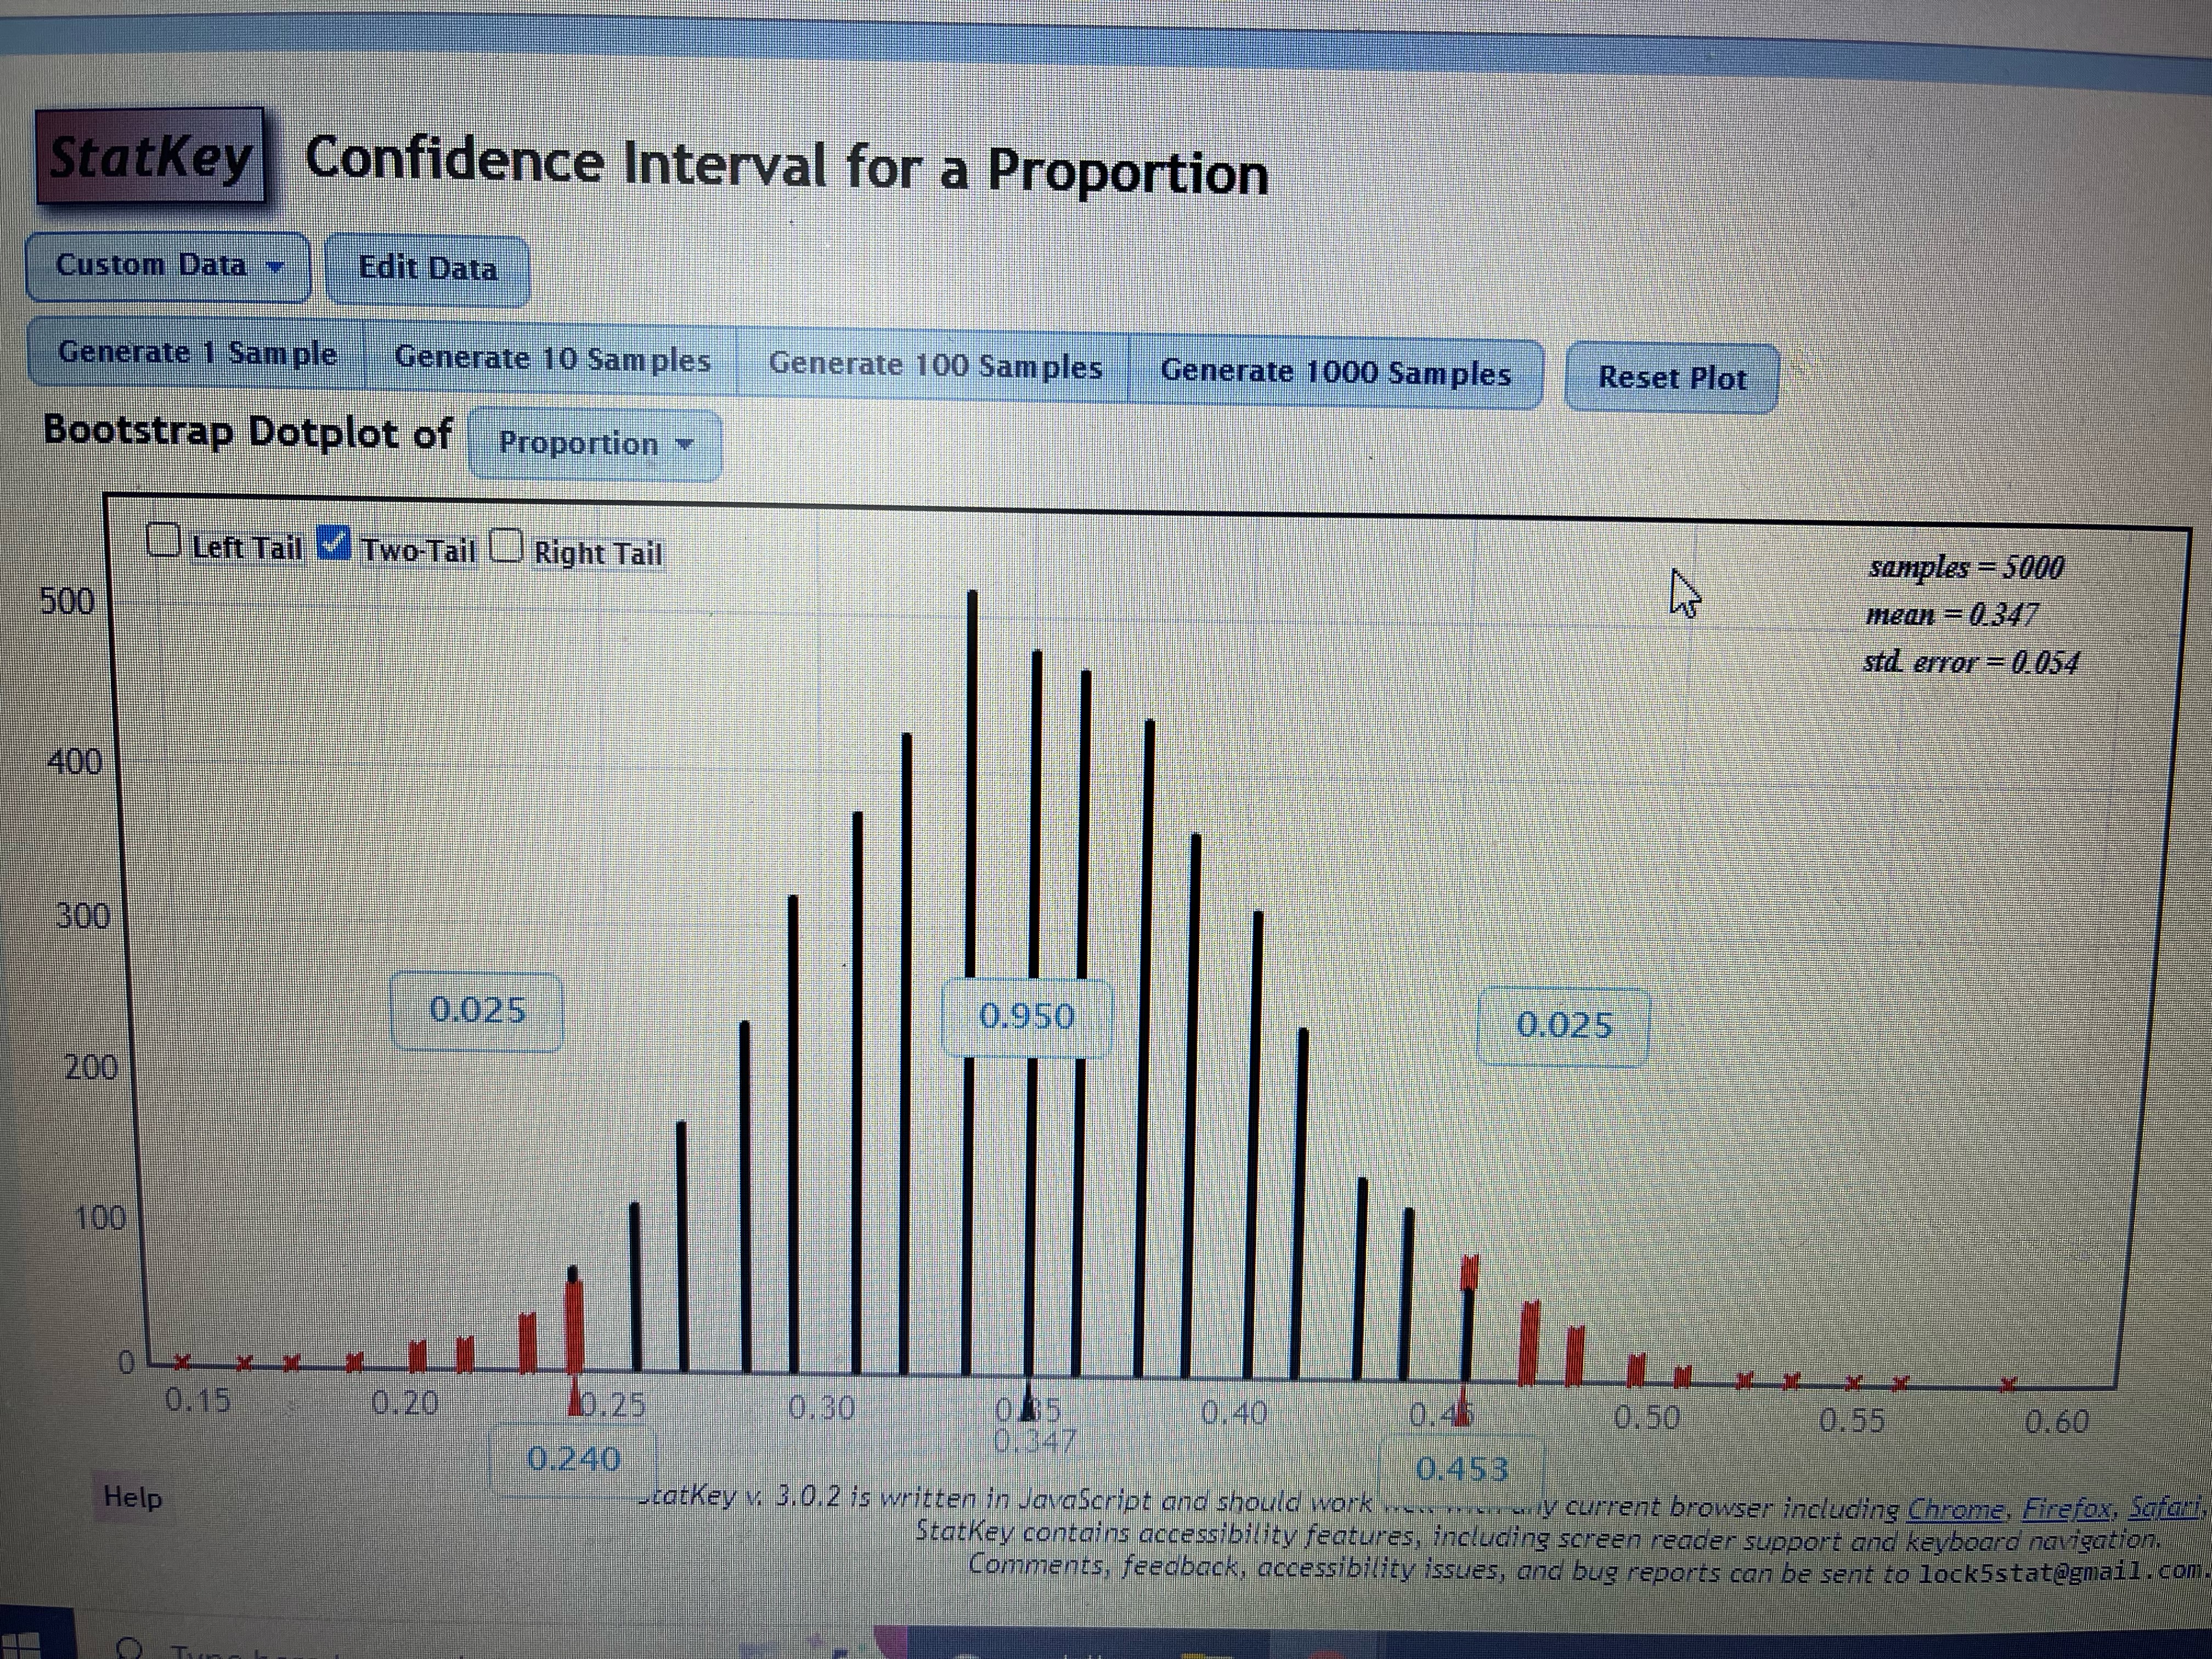
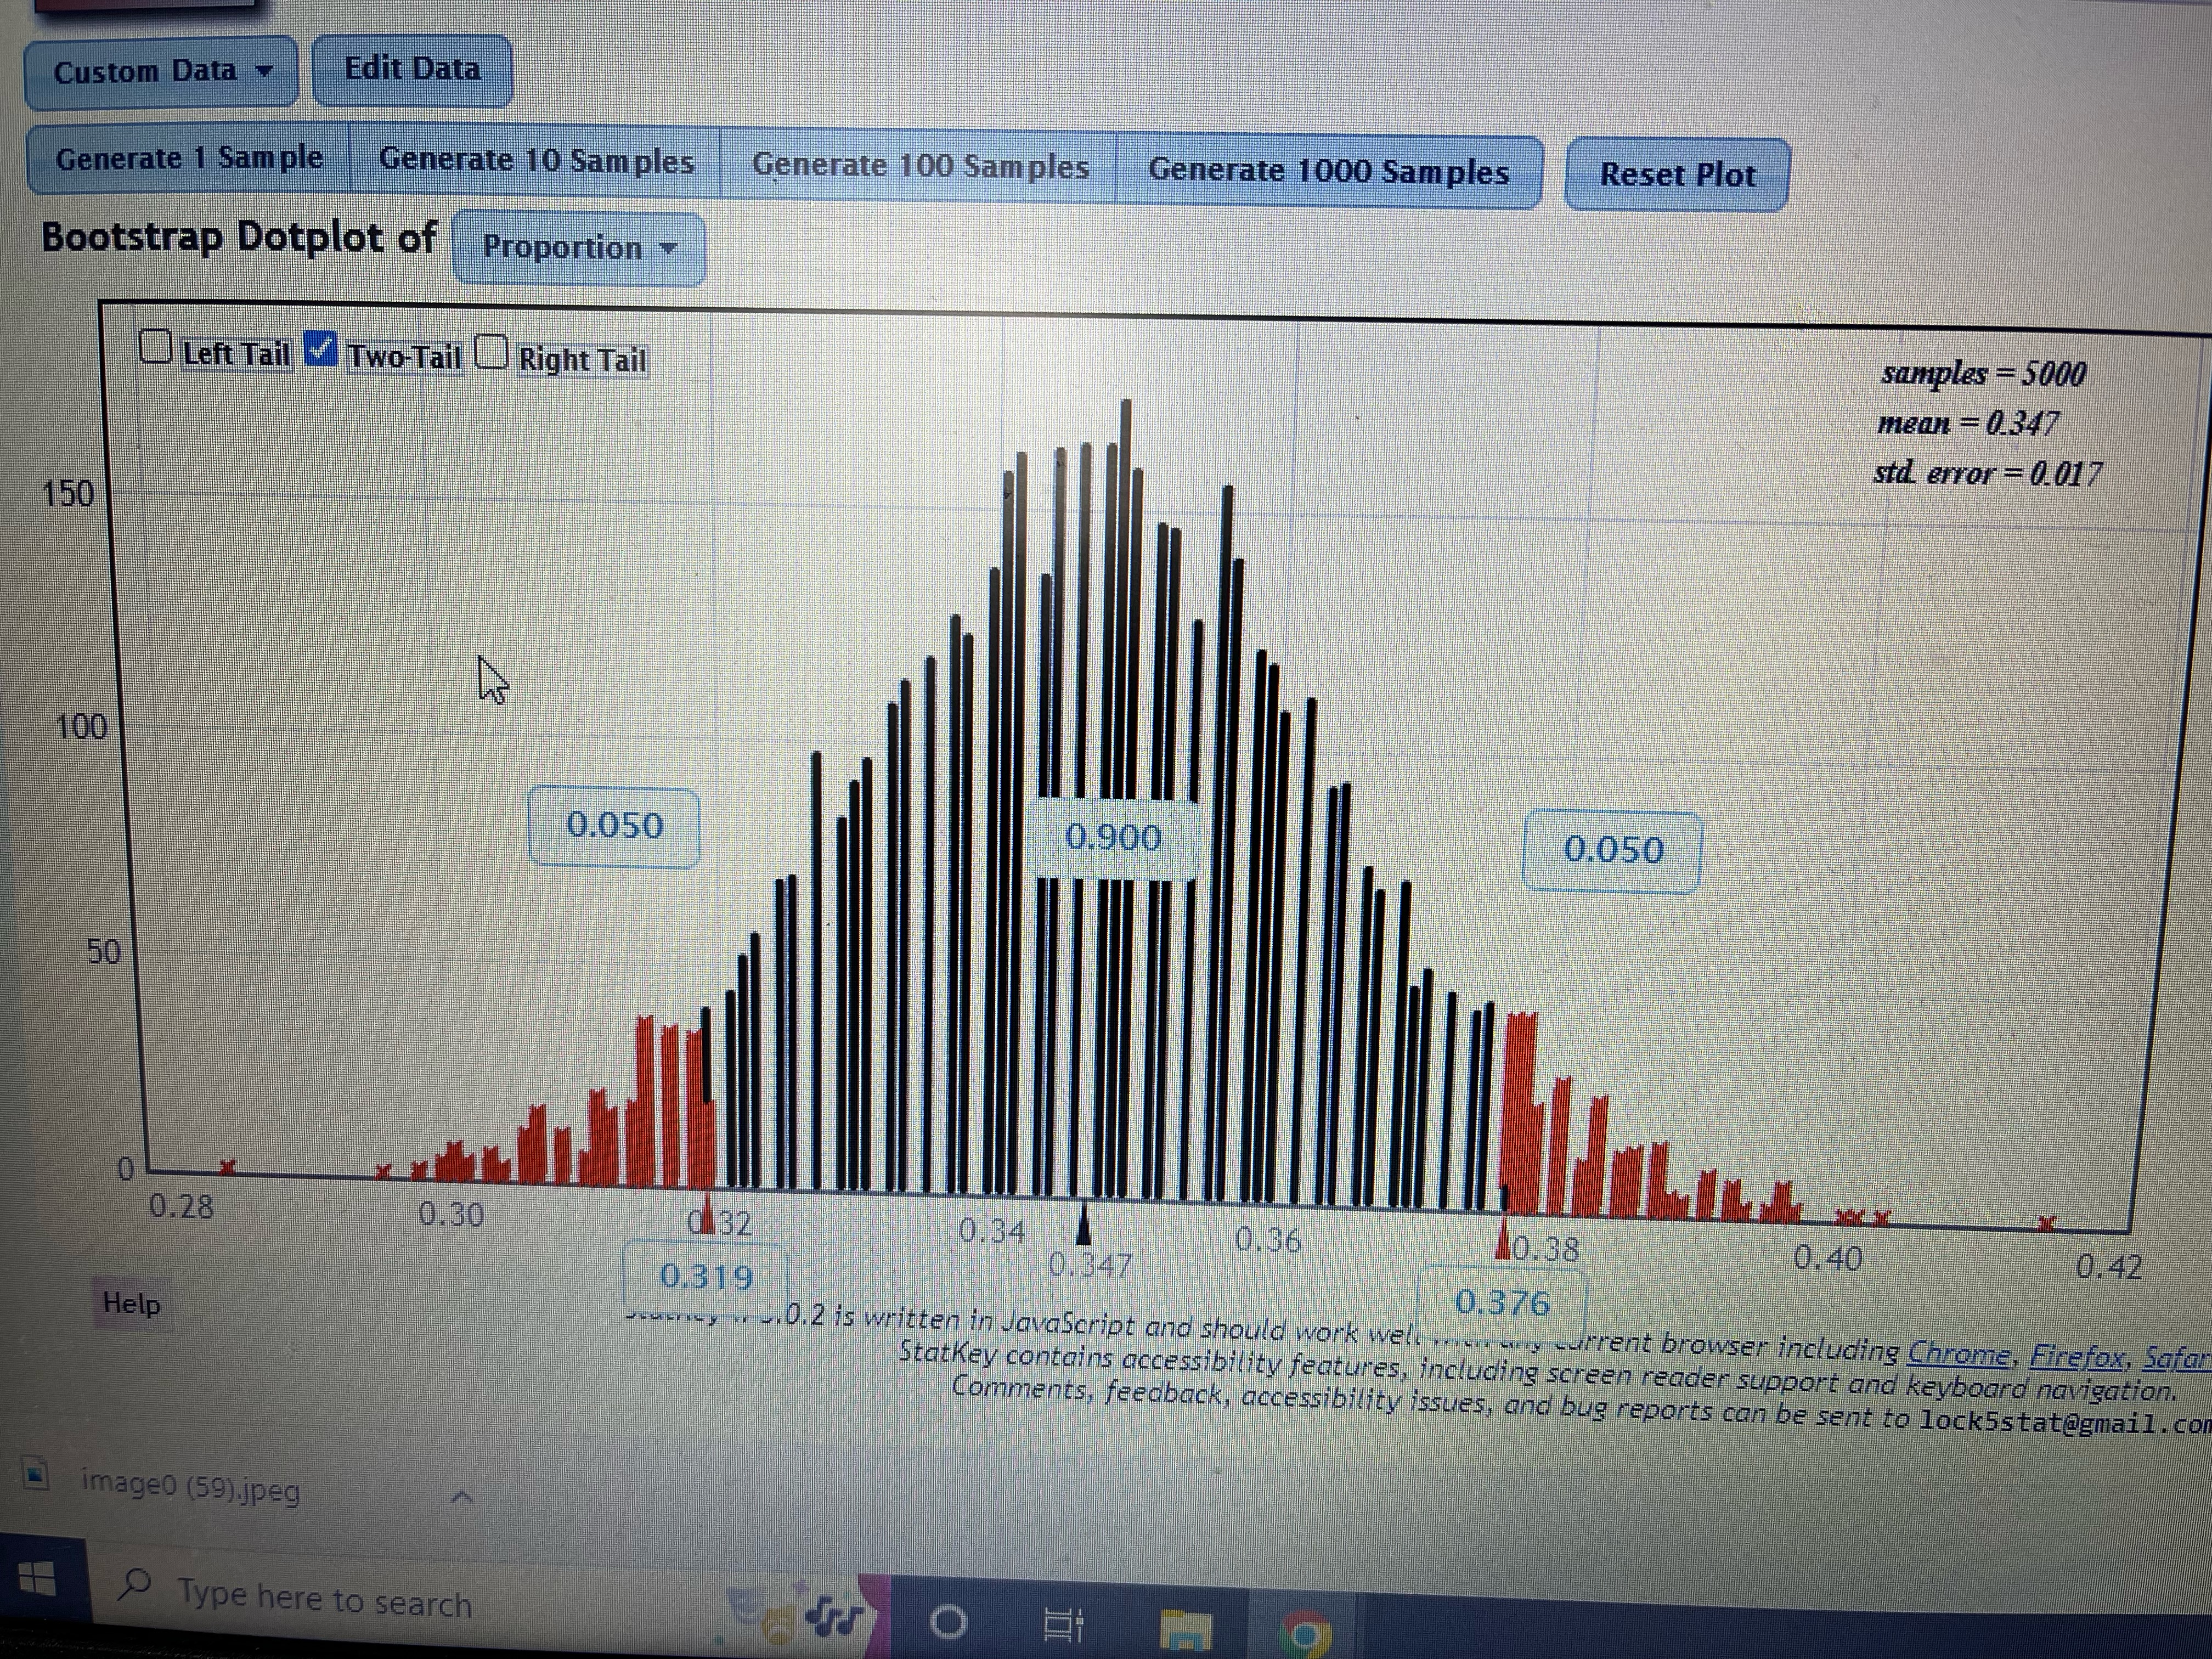
StatKey Confidence Interval for a Proportion Custom Data Edit Data Generate 10 Samples Generate 100 Samples Generate 1000 Samples Reset Plot Bootstrap Dotplot of Proportion Left Tail W Two-Tail Right Tail samples = 5000 500 mean = 0.347 std. error = 0.054 400 300 0.025 950 0.025 200 00 0. 15 0. 20 ).30 0.55 0.60 0.240 Help catkey v. 3.0.2 is written in JavaScript and should work bess . arany current browser including Chrome, Firefox, Saidfly Statkey contains accessibility features, including screen reader support and keyboard navigation. Comments, feedback, accessibility issues, and bug reports can be sent to lock5stat@gmail . comCustom Data ~ Edit Data Generate 1 Sample rate 10 Samples Generate 100 Samples Generate 1000 Samples Reset Plot Bootstrap Dotplot of Proportion Left Tail / Two-Tail Right Tail samples = 5000 mean = 0.347 std. error = 0.017 150 100 0.050 0.900 0.050 0.28 0.30 Mo. 38 0.40 0.319 0.42 Help 0.376 hey . _.0.2 is written in JavaScript and should work well .it. we, current browser including Chrome, Firefox, Sofa Statkey contains accessibility features, including screen reader support and keyboard navigation. Comments, feedback, accessibility issues, and bug reports can be sent to lock5stat@gmail . co image0 (59).jpeg Type here to search H O
Step by Step Solution
There are 3 Steps involved in it

Get step-by-step solutions from verified subject matter experts