

Question: Activity 6: Graphing Open a web browser and navigate to the Quick Graph tool located at the below URL: https:/www.thephysicsaviary .com/Physics Programs/Tools/Graphing/index. html 23. Table
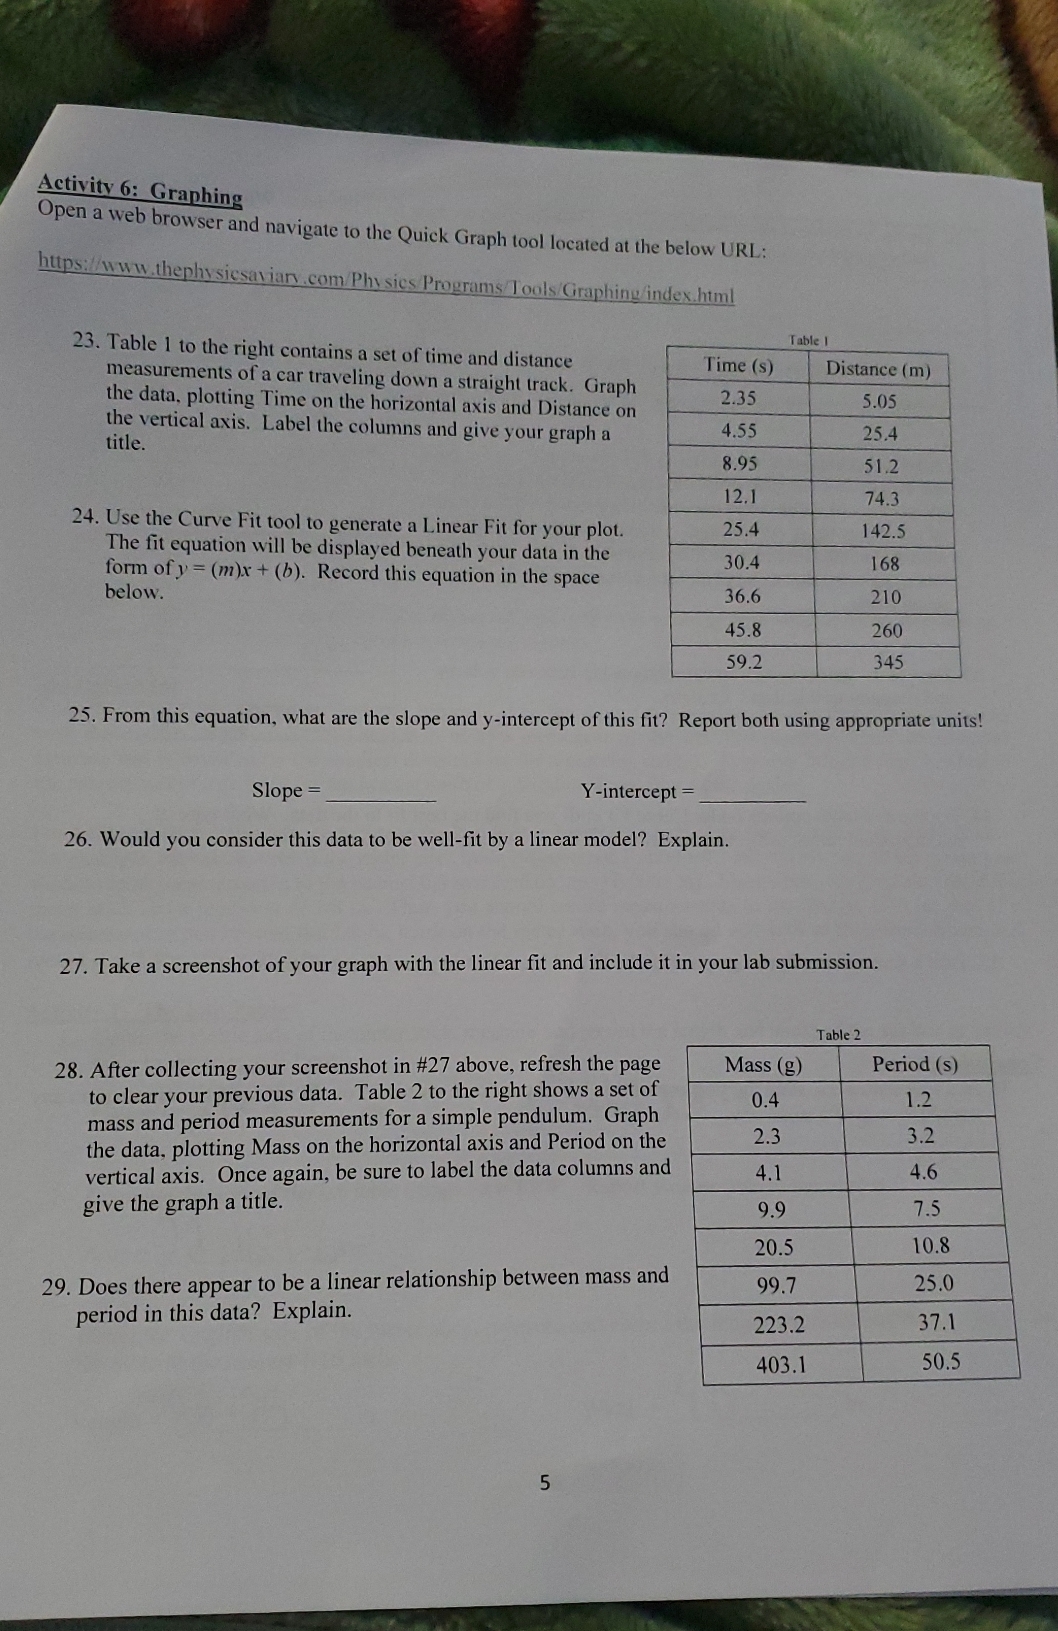
Activity 6: Graphing Open a web browser and navigate to the Quick Graph tool located at the below URL: https:/www.thephysicsaviary .com/Physics Programs/Tools/Graphing/index. html 23. Table 1 to the right contains a set of time and distance Table I measurements of a car traveling down a straight track. Graph Time (s) Distance (m) the data, plotting Time on the horizontal axis and Distance on 2.35 5.05 title. the vertical axis. Label the columns and give your graph a 1.55 25.4 8.95 51.2 12. 1 74.3 24. Use the Curve Fit tool to generate a Linear Fit for your plot. 25.4 The fit equation will be displayed beneath your data in the 142.5 form of y = (m)x + (b). Record this equation in the space 30.4 168 below. 36.6 210 45.8 260 59.2 345 25. From this equation, what are the slope and y-intercept of this fit? Report both using appropriate units! Slope = Y-intercept = 26. Would you consider this data to be well-fit by a linear model? Explain. 27. Take a screenshot of your graph with the linear fit and include it in your lab submission. Table 2 28. After collecting your screenshot in #27 above, refresh the page Mass (g) Period (s) to clear your previous data. Table 2 to the right shows a set of mass and period measurements for a simple pendulum. Graph 0.4 1.2 the data, plotting Mass on the horizontal axis and Period on the 2.3 3.2 vertical axis. Once again, be sure to label the data columns and 4.1 4.6 give the graph a title. 9.9 7.5 20.5 10.8 29. Does there appear to be a linear relationship between mass and 99.7 25.0 period in this data? Explain. 223.2 37.1 403.1 50.5 5
Step by Step Solution
There are 3 Steps involved in it

Get step-by-step solutions from verified subject matter experts