

Question: Activity Normal Time Crash Time Normal Cost Crash Cost A 0 0 0 0 B 15 10 7000 8500 C 6 4 2000 3000 D
| Activity | Normal Time | Crash Time | Normal Cost | Crash Cost |
| A | 0 | 0 | 0 | 0 |
| B | 15 | 10 | 7000 | 8500 |
| C | 6 | 4 | 2000 | 3000 |
| D | 2 | 2 | 500 | 5 00 |
| E | 4 | 4 | 3500 | 3500 |
| F | 5 | 3 | 4000 | 4400 |
| G | 7 | 5 | 3000 | 4000 |
| H | 6 | 6 | 1000 | 1000 |
| I | 0 | 0 | 0 | 0 |
| J | 4 | 4 | 3000 | 3000 |
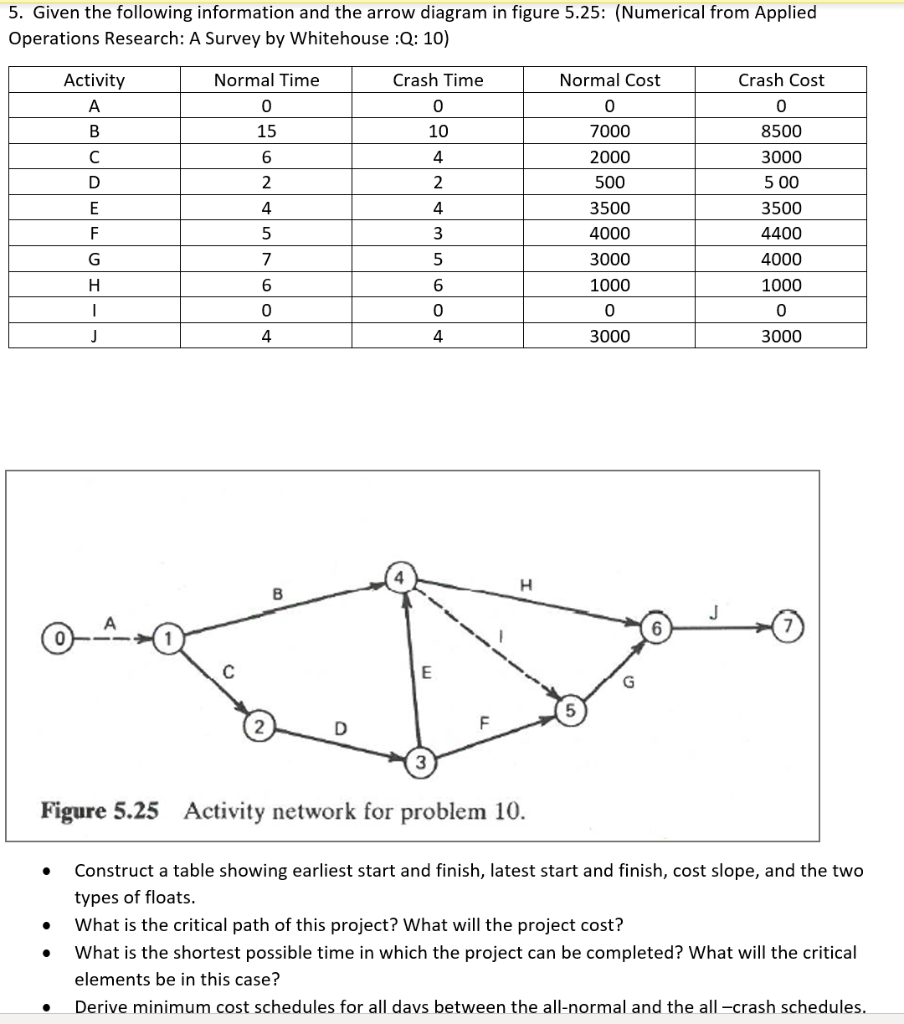
- Construct a table showing earliest start and finish, latest start and finish, cost slope, and the two types of floats.
- What is the critical path of this project? What will the project cost?
Step by Step Solution
There are 3 Steps involved in it
1 Expert Approved Answer
Step: 1 Unlock

Question Has Been Solved by an Expert!
Get step-by-step solutions from verified subject matter experts
Step: 2 Unlock
Step: 3 Unlock