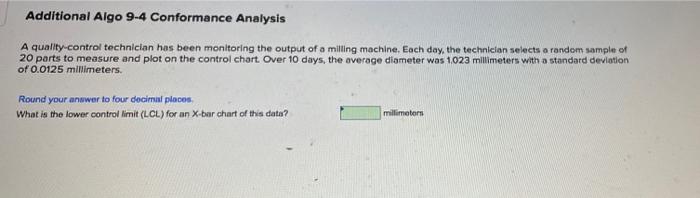
Question: Additional Algo 9-4 Conformance Analysis A quality-control technician has been monitoring the output of a milling machine. Each day, the technician selects a randem sample

Additional Algo 9-4 Conformance Analysis A
Additional Algo 9-4 Conformance Analysis A quality-control technician has been monitoring the output of a milling machine. Each day, the technician selects a randem sample of 20 parts to measure and plot on the control chart. Over 10 days, the average dibmeter was 1.023 millimeters with a standard deviation of 0.0125 millimeters. Round your answer to four docimial places. What is the lower control limit (LCL) for an X-bar chart of this data? millemetorn

Step by Step Solution

There are 3 Steps involved in it

1 Expert Approved Answer
Step: 1 Unlock blur-text-image
Question Has Been Solved by an Expert!

Get step-by-step solutions from verified subject matter experts

Step: 2 Unlock
Step: 3 Unlock

Students Have Also Explored These Related General Management Questions!