

Question: DO NOT GIVE 1.5320 as an answer because it is wrong! Additional Algo 9-4 Conformance Analysis A quality-control technician has been monitoring the output of
DO NOT GIVE 1.5320 as an answer because it is wrong! 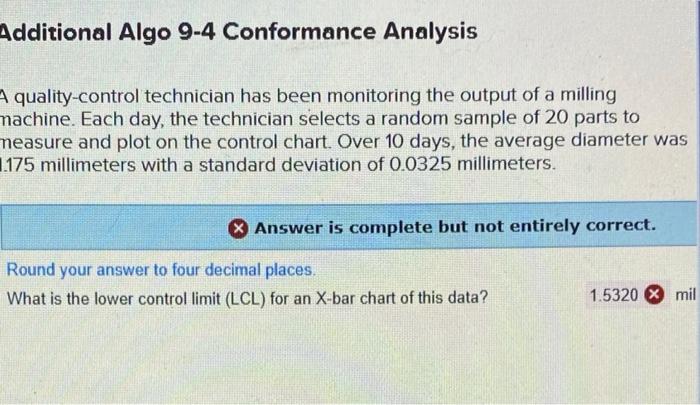
Additional Algo 9-4 Conformance Analysis A quality-control technician has been monitoring the output of a milling machine. Each day, the technician selects a random sample of 20 parts to measure and plot on the control chart. Over 10 days, the average diameter was 1.175 millimeters with a standard deviation of 0.0325 millimeters. Answer is complete but not entirely correct. Round your answer to four decimal places. What is the lower control limit (LCL) for an X-bar chart of this data? 1.5320 mil
Step by Step Solution
There are 3 Steps involved in it
1 Expert Approved Answer
Step: 1 Unlock

Question Has Been Solved by an Expert!
Get step-by-step solutions from verified subject matter experts
Step: 2 Unlock
Step: 3 Unlock