

Question: After answering option A you use option A to answer option B which is the second picture. 1 - Microsoft Edge https://www.mathxl.com/Student/PlayerHomework.aspx?homeworkid=570273077&questionld=2&flushed=false&cld=6101031&ce.. MAT 122 B2
After answering option A you use option A to answer option B which is the second picture.
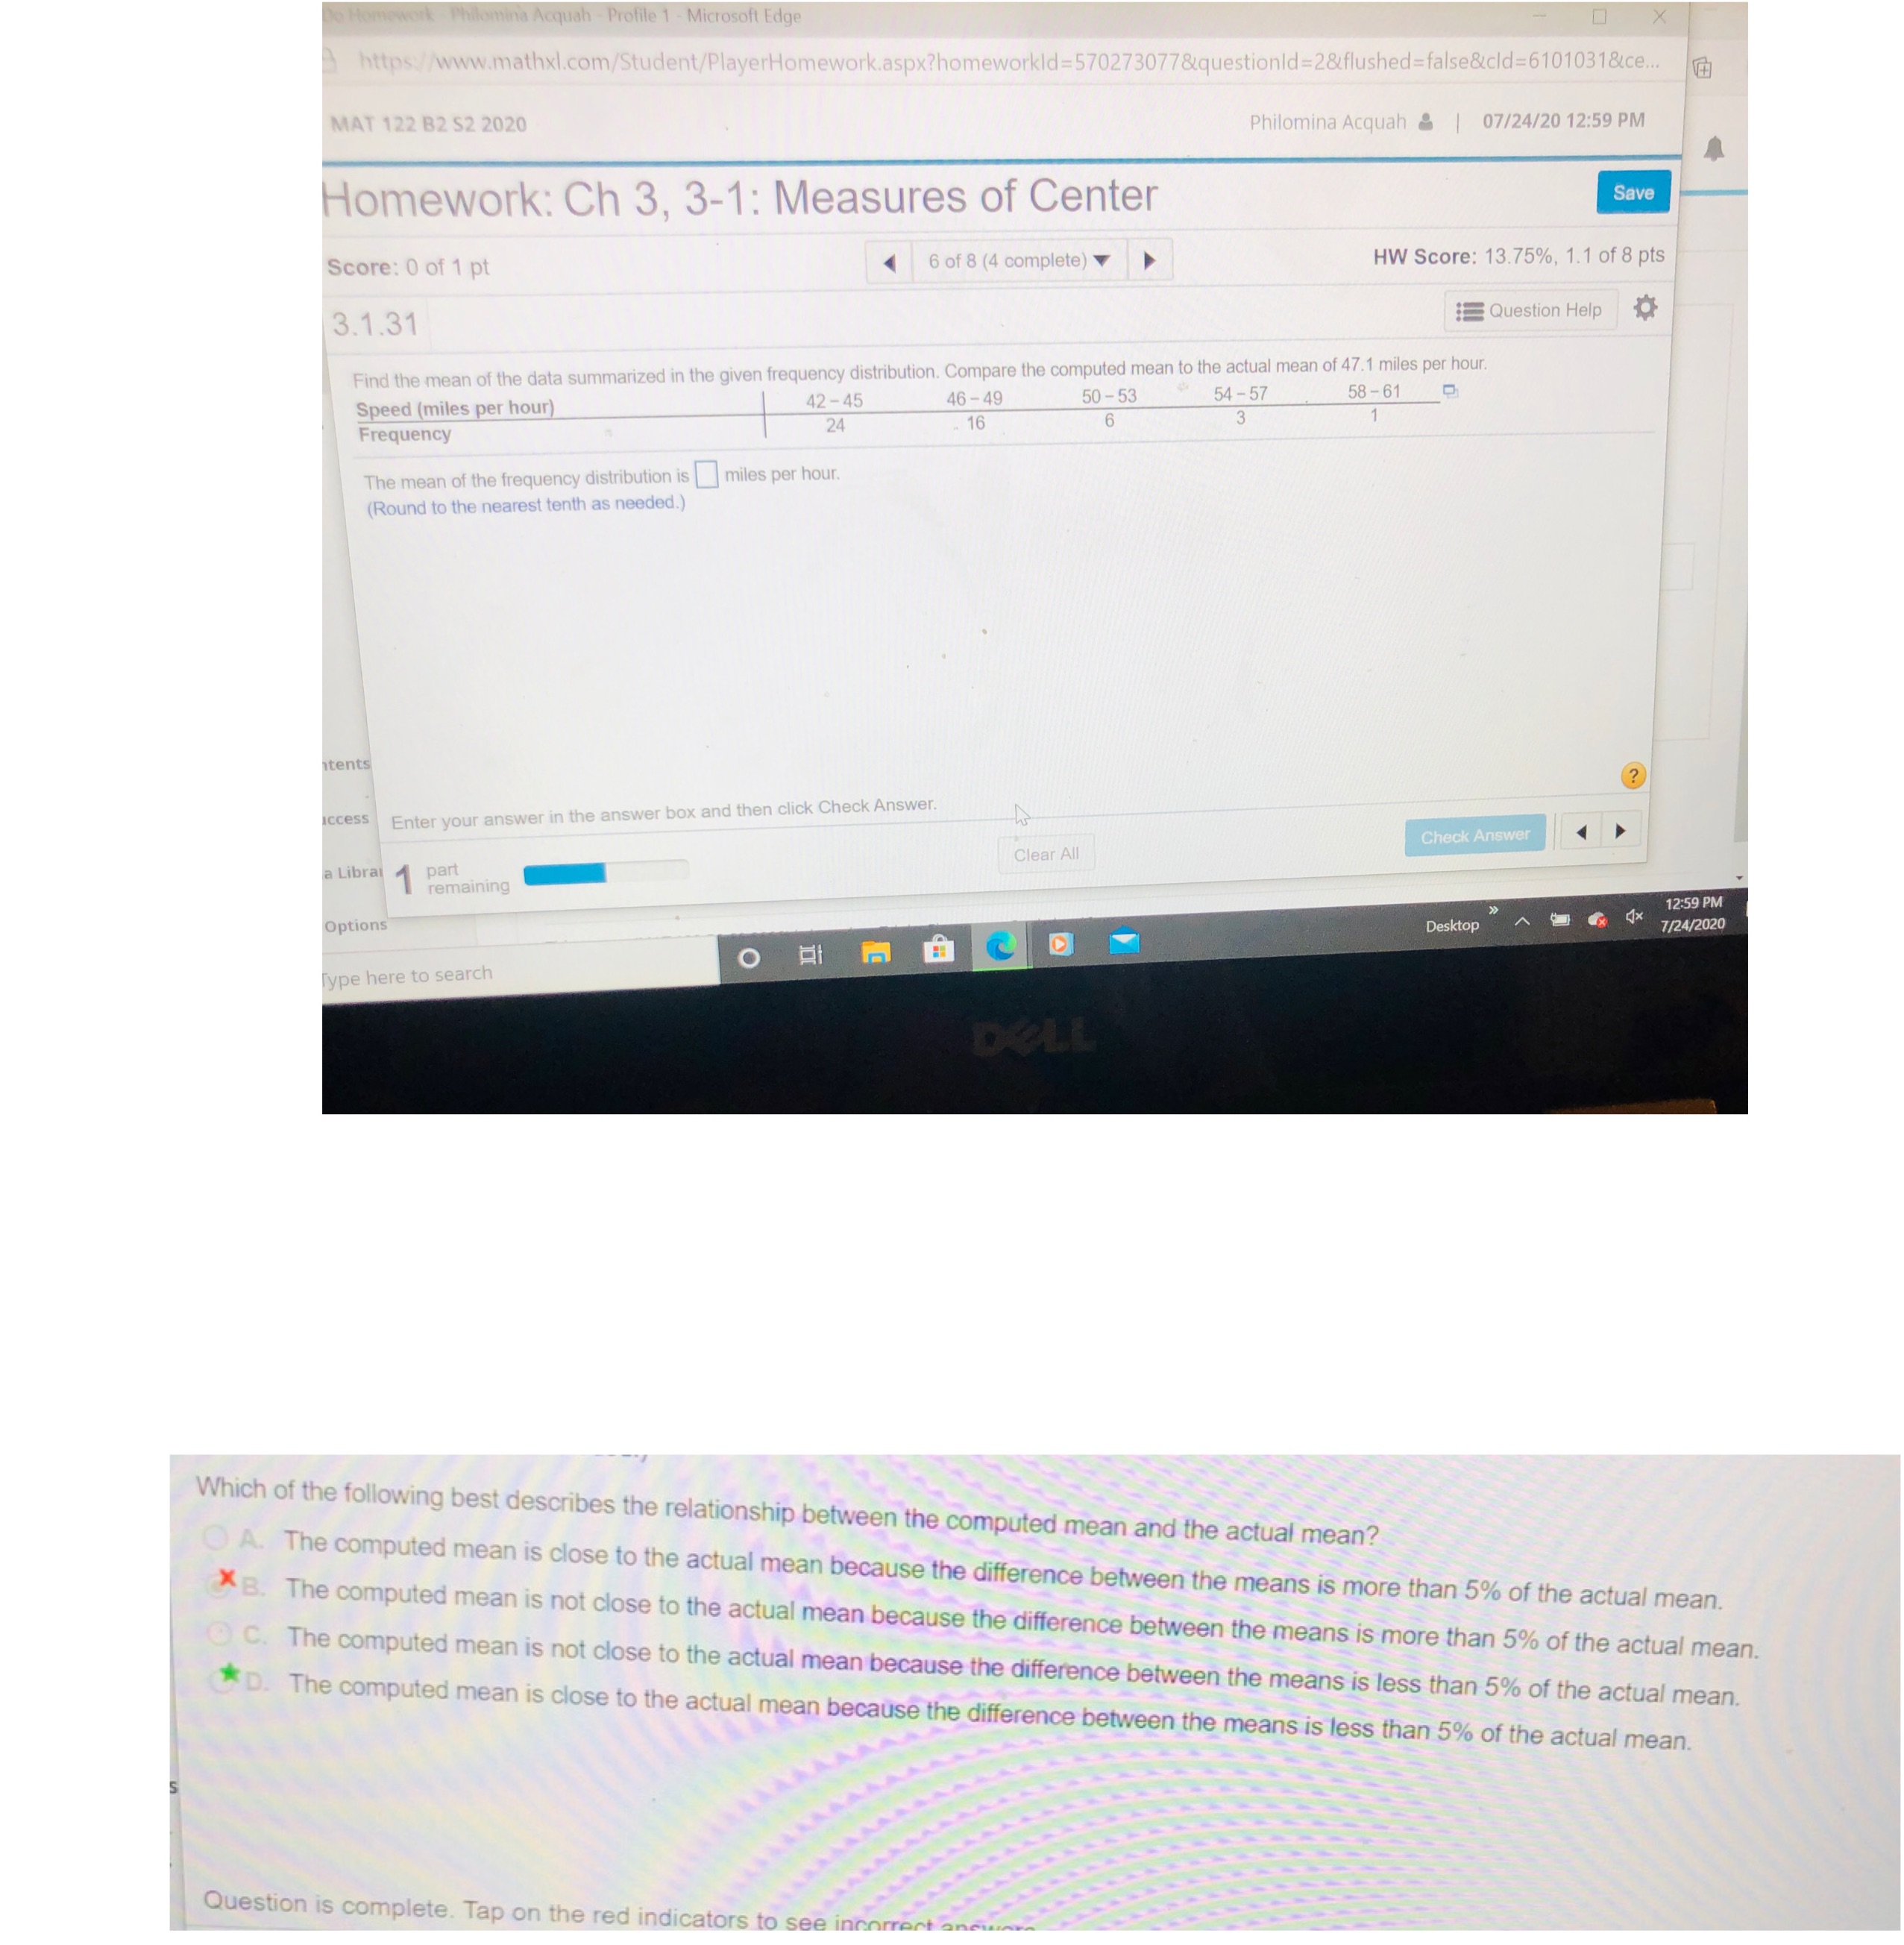
1 - Microsoft Edge https://www.mathxl.com/Student/PlayerHomework.aspx?homeworkid=570273077&questionld=2&flushed=false&cld=6101031&ce.. MAT 122 B2 $2 2020 Philomina Acquah & | 07/24/20 12:59 PM Homework: Ch 3, 3-1: Measures of Center Save Score: 0 of 1 pt |6 of 8 (4 complete) HW Score: 13.75%, 1.1 of 8 pts 3.1.31 Question Help Find the mean of the data summarized in the given frequency distribution. Compare the computed mean to the actual mean of 47.1 miles per hour. Speed (miles per hour) 42-45 46 -49 54-57 Frequency 16 50- 53 58-61 The mean of the frequency distribution is miles per hour. (Round to the nearest tenth as needed.) itents ccess Enter your answer in the answer box and then click Check Answer. ? a Libral part Clear All Check Answer remaining Options Desktop 12:59 PM ~ X 7/24/2020 type here to search DELL Which of the following best describes the relationship between the computed mean and the actual mean? A. The computed mean is close to the actual mean because the difference between the means is more than 5% of the actual mean. XB. The computed mean is not close to the actual mean because the difference between the means is more than 5% of the actual mean. C. The computed mean is not close to the actual mean because the difference between the means is less than 5% of the actual mean. *D. The computed mean is close to the actual mean because the difference between the means is less than 5% of the actual mean. Question is complete. Tap on the red indicators to see
Step by Step Solution
There are 3 Steps involved in it

Get step-by-step solutions from verified subject matter experts