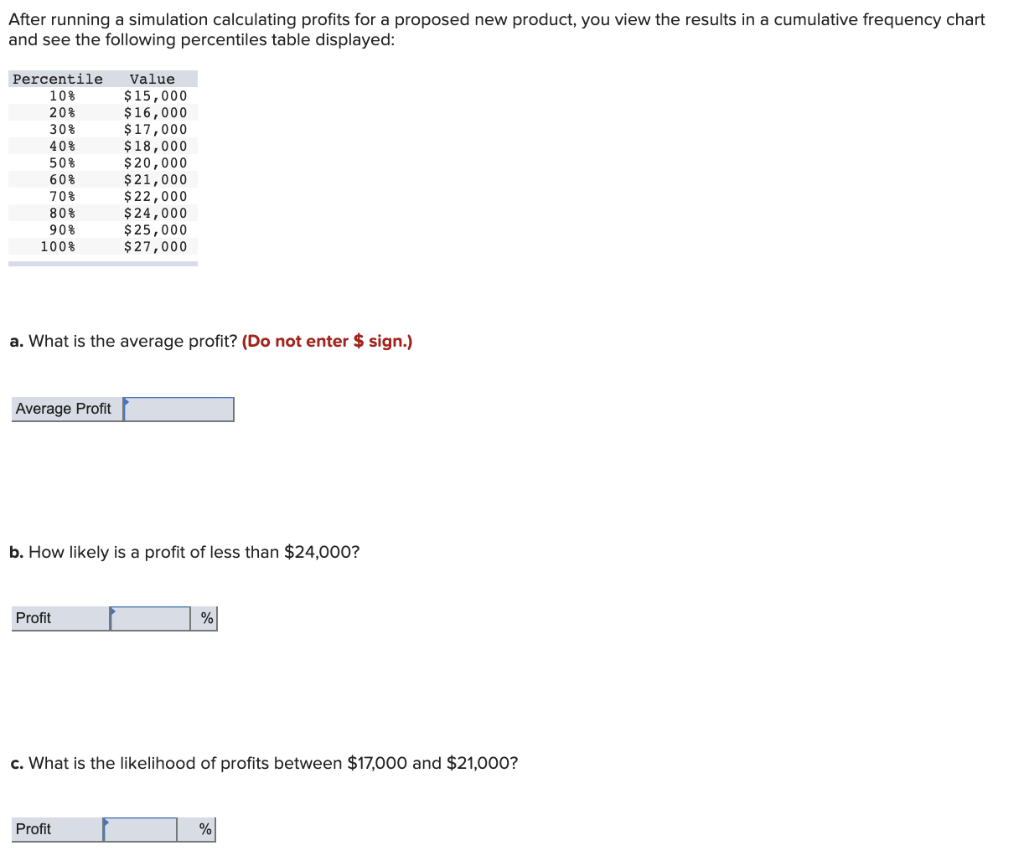
Question: After running a simulation calculating profits for a proposed new product, you view the results in a cumulative frequency chart and see the following percentiles

After running a simulation calculating profits

After running a simulation calculating profits for a proposed new product, you view the results in a cumulative frequency chart and see the following percentiles table displayed: Percentile 108 20% 30% 40% TI 50% 60% 70% 80% 90% 100% Value $15,000 $ 16,000 $17,000 $ 18,000 $ 20,000 $ 21,000 $ 22,000 $ 24,000 $ 25,000 $ 27,000 a. What is the average profit? (Do not enter $ sign.) Average Profit b. How likely is a profit of less than $24,000? Profit % c. What is the likelihood of profits between $17,000 and $21,000? Profit %

Step by Step Solution

There are 3 Steps involved in it

1 Expert Approved Answer
Step: 1 Unlock blur-text-image
Question Has Been Solved by an Expert!

Get step-by-step solutions from verified subject matter experts

Step: 2 Unlock
Step: 3 Unlock

Students Have Also Explored These Related General Management Questions!