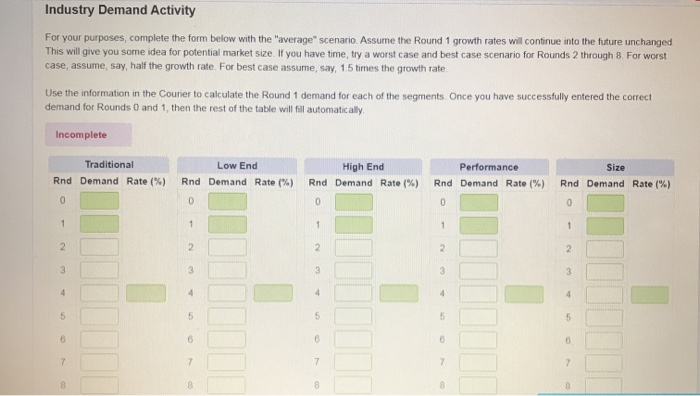
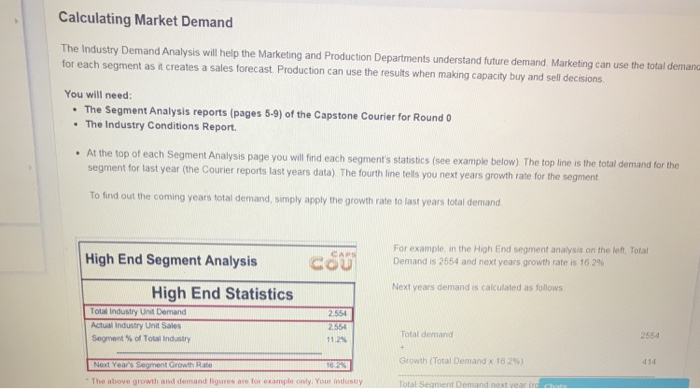
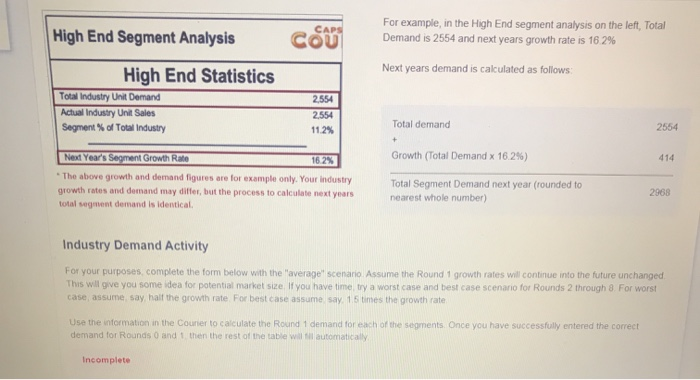
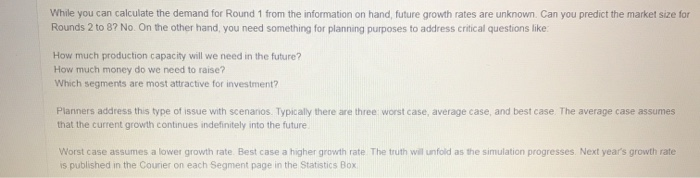
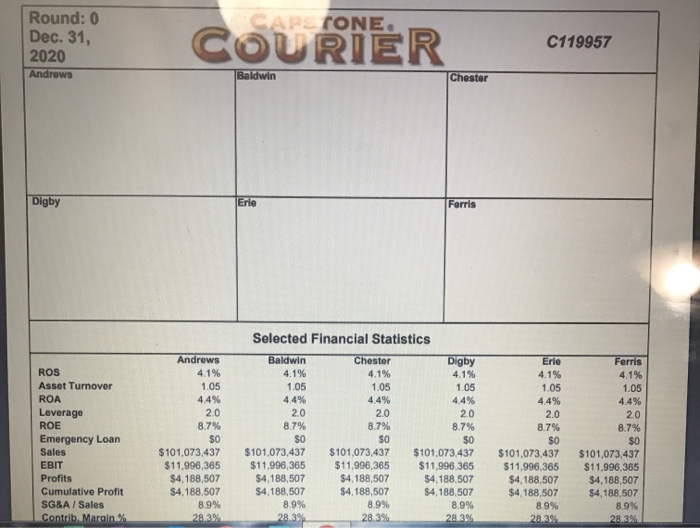
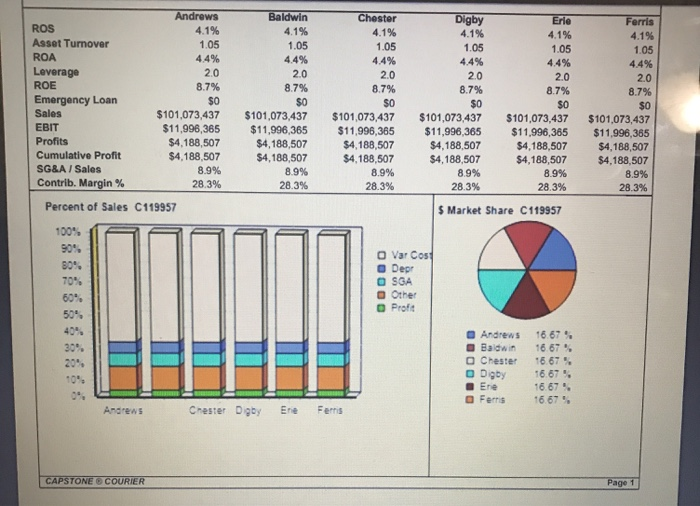
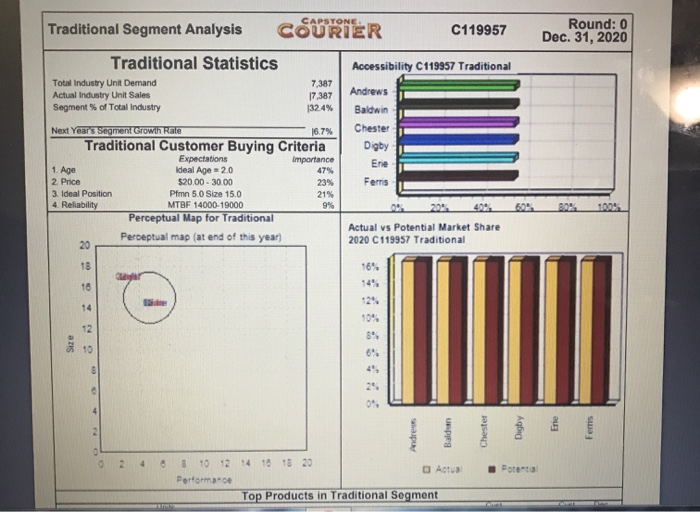
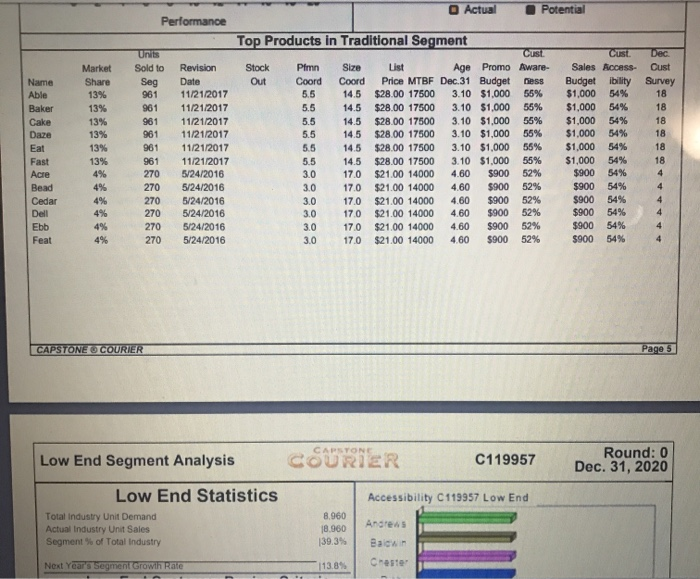
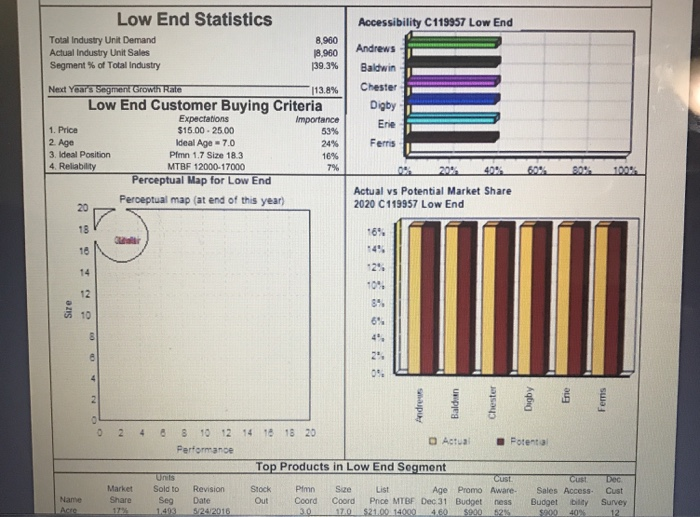
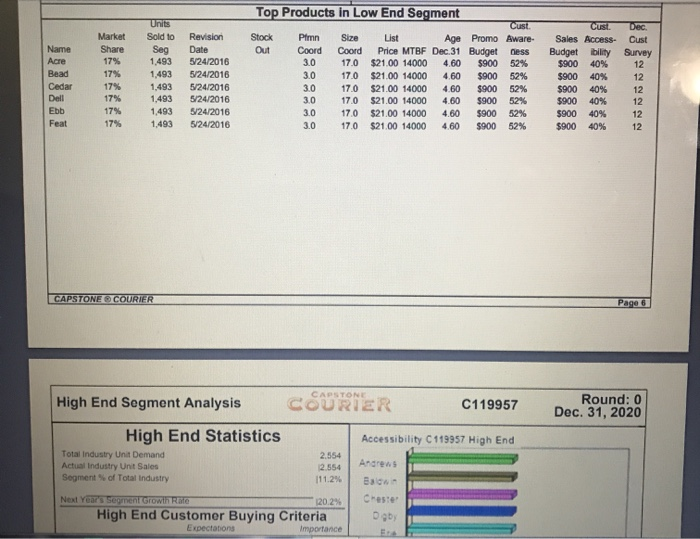
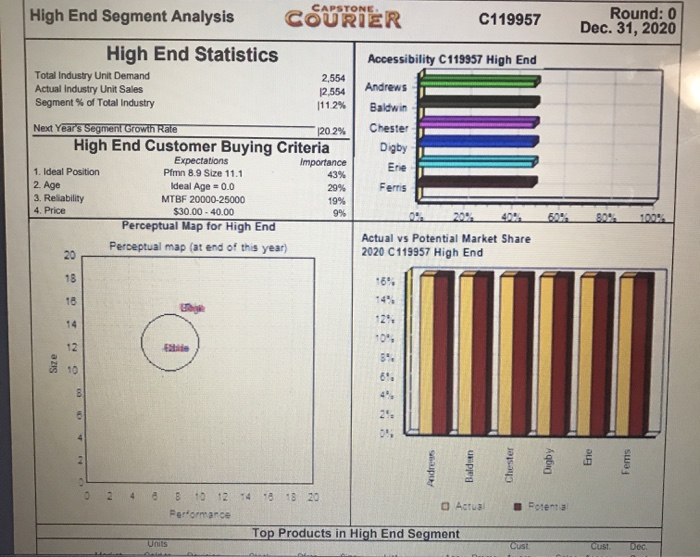
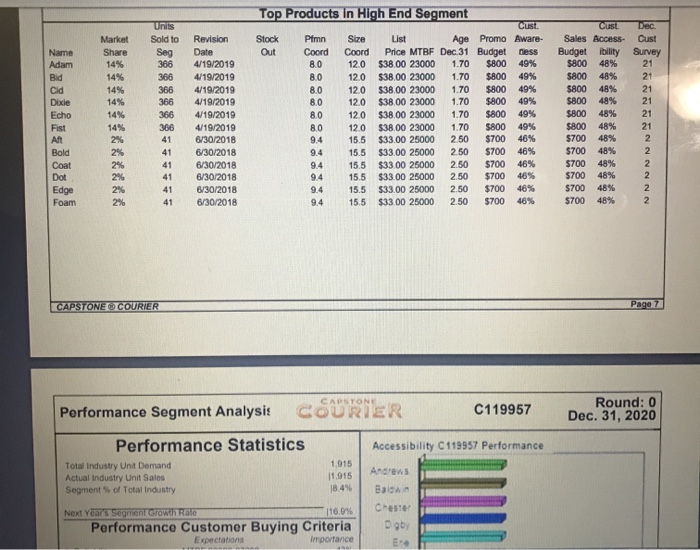
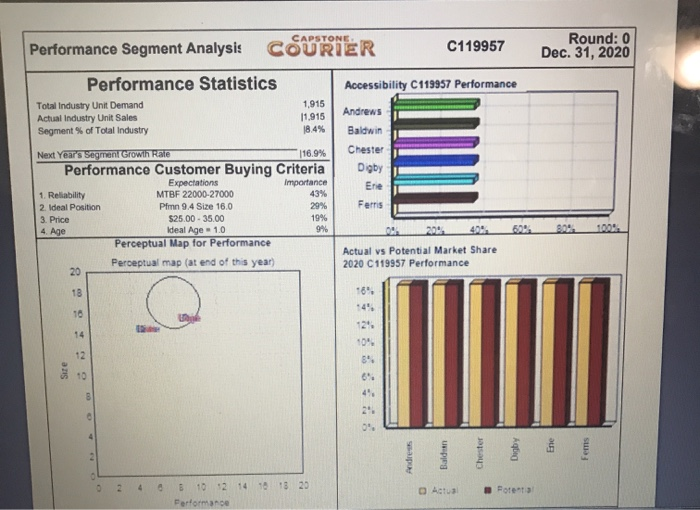
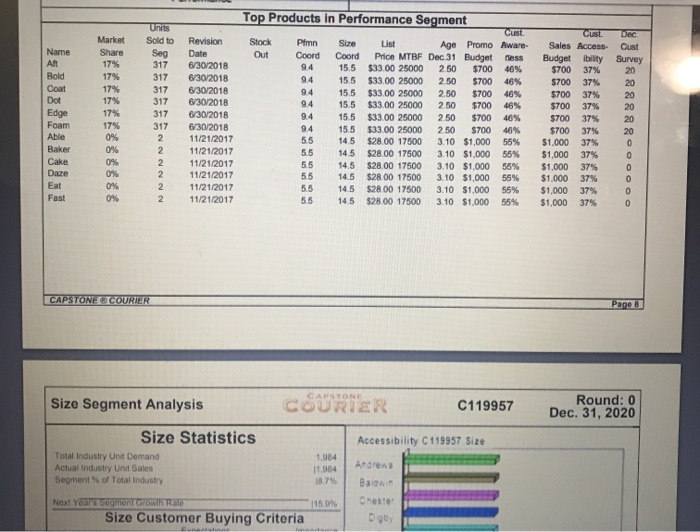
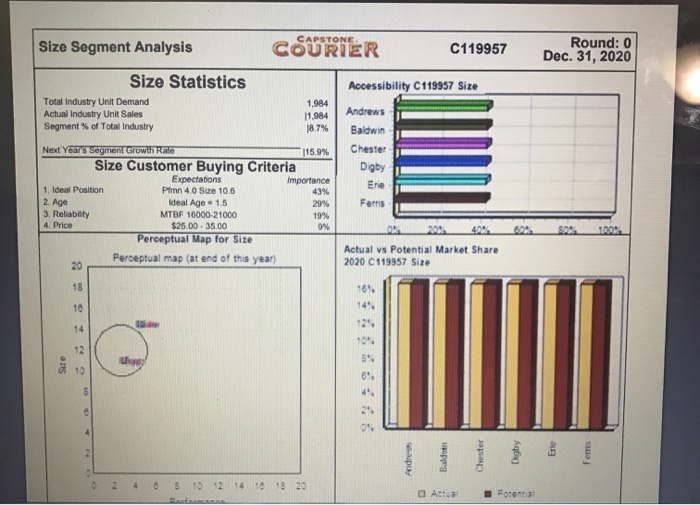
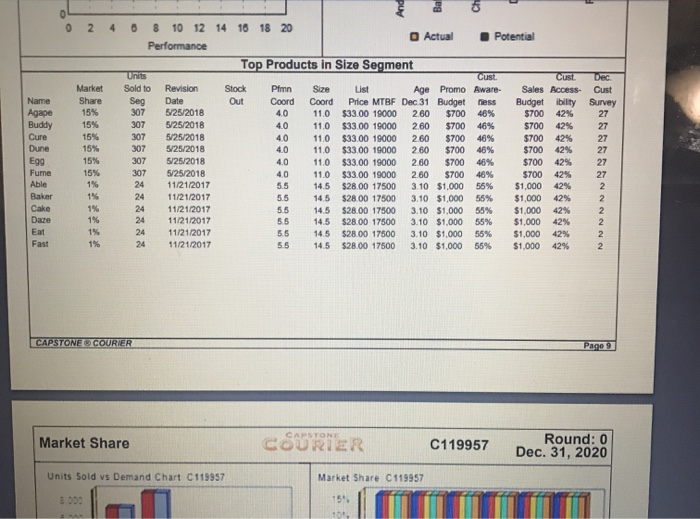
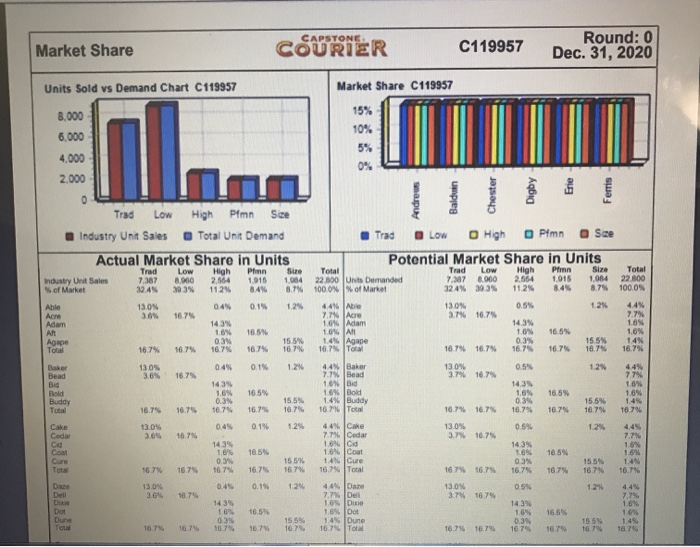
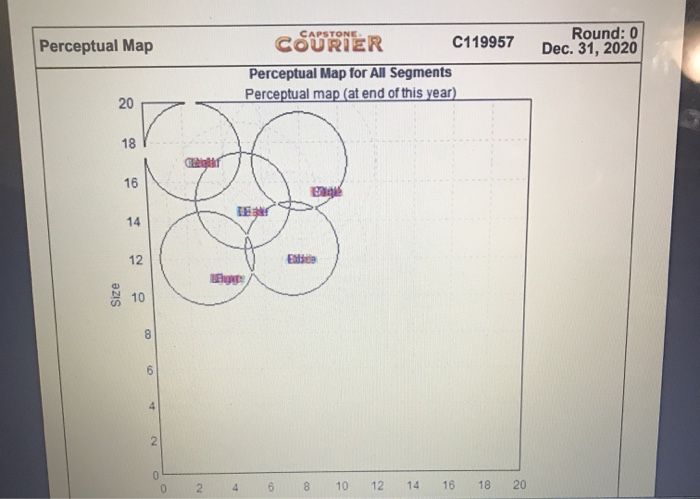
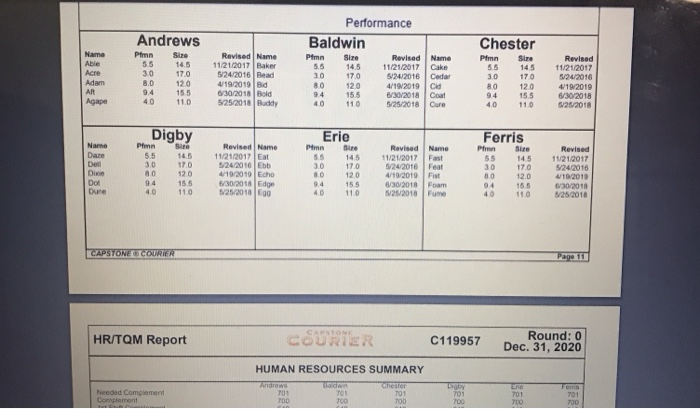
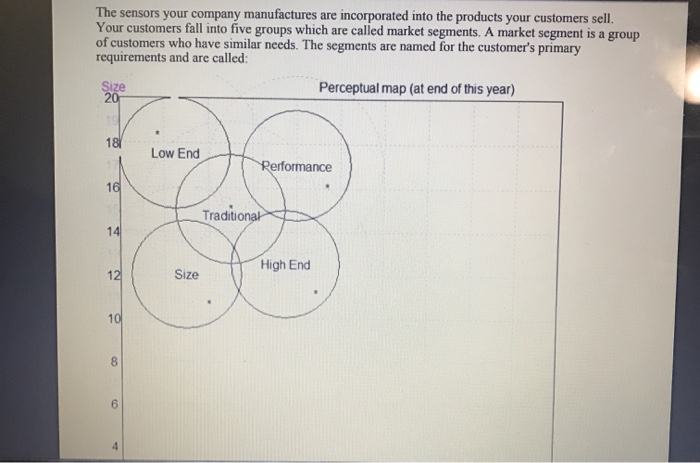
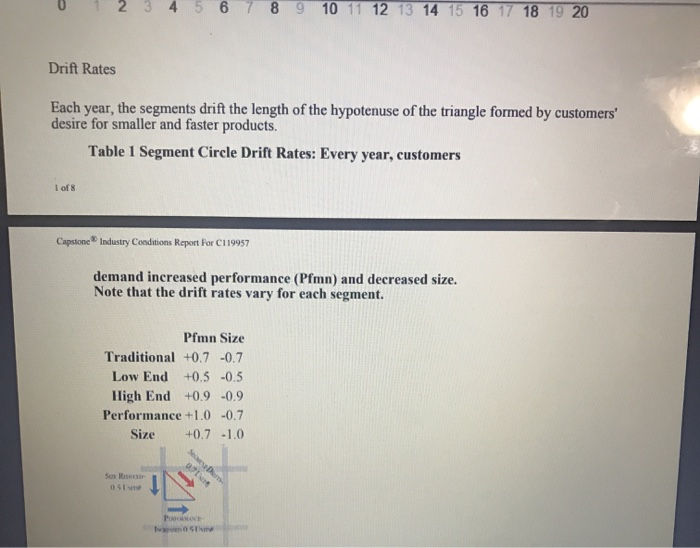
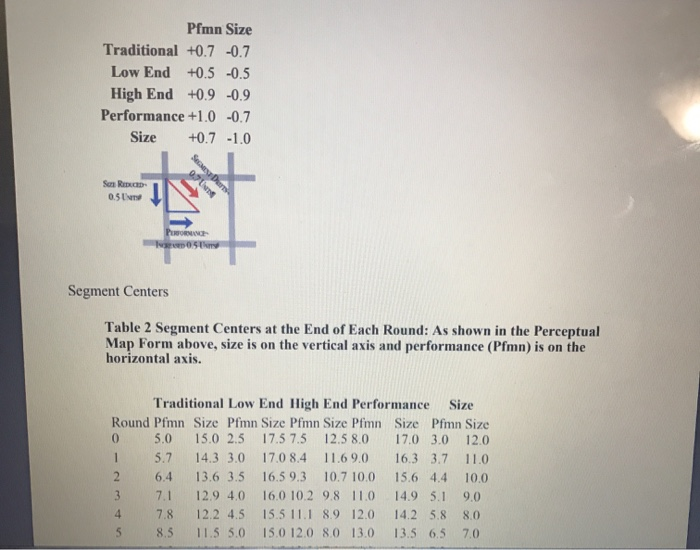
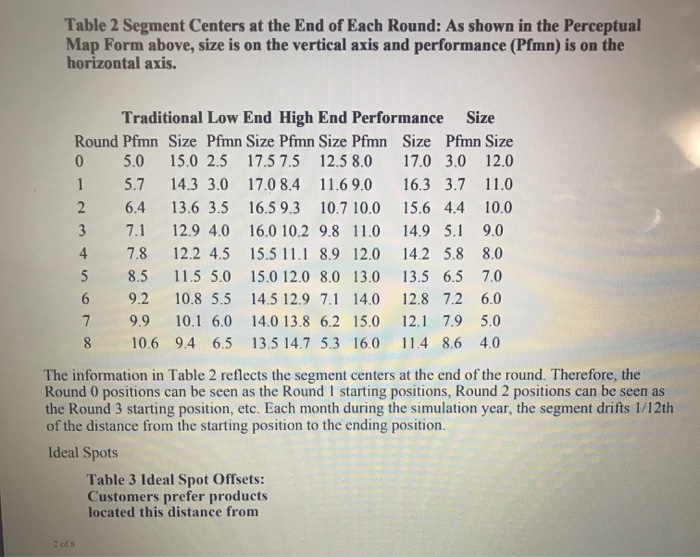
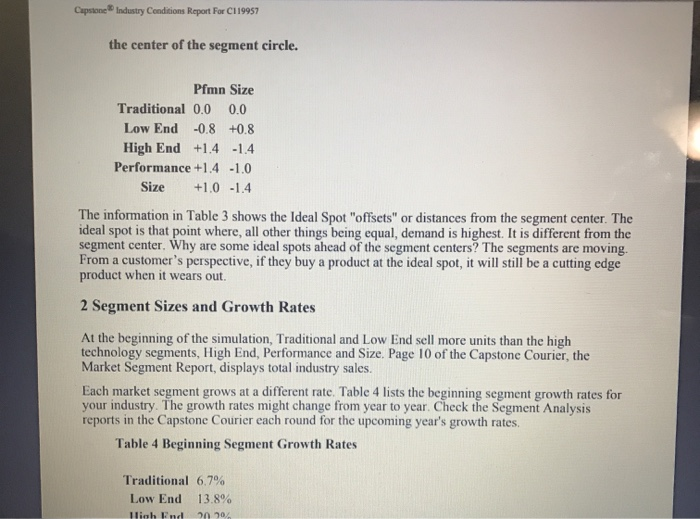
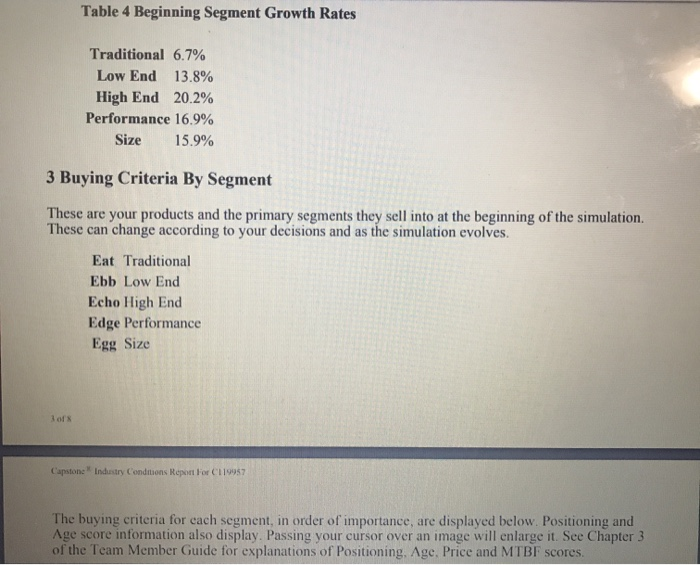
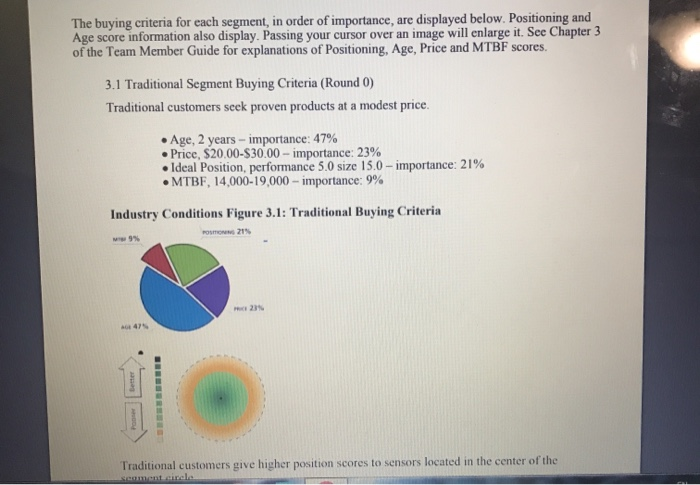
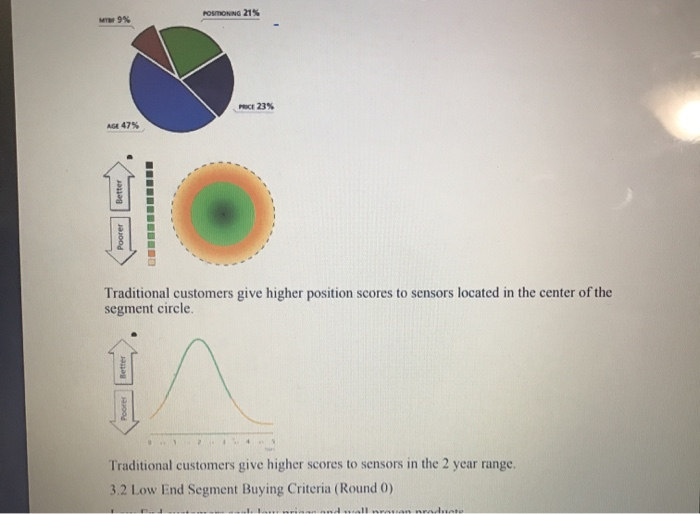
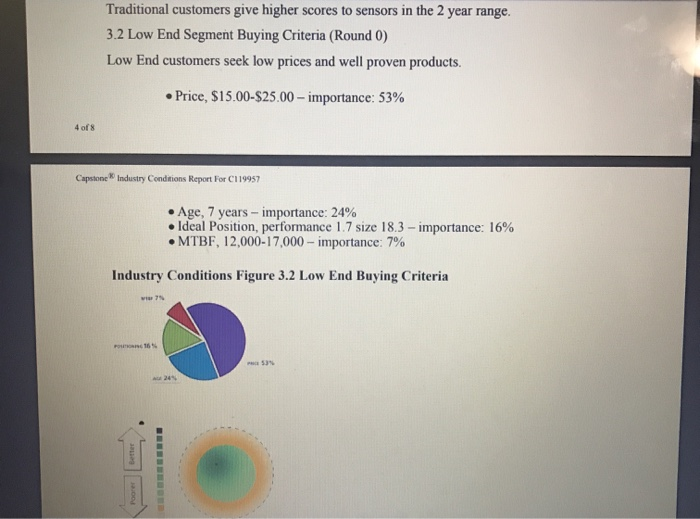
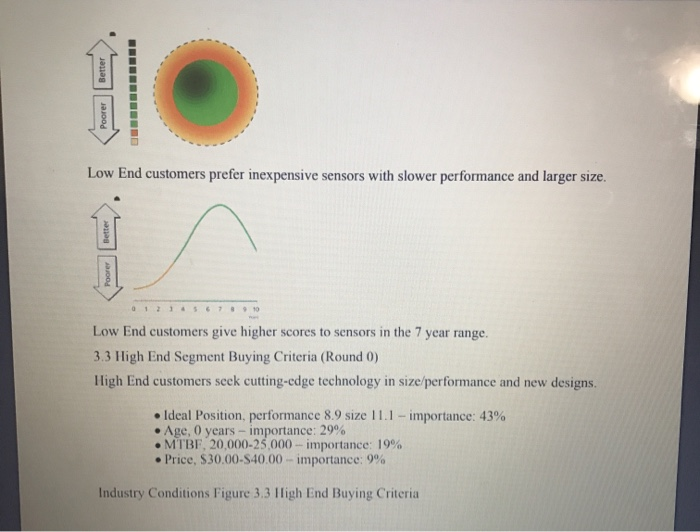
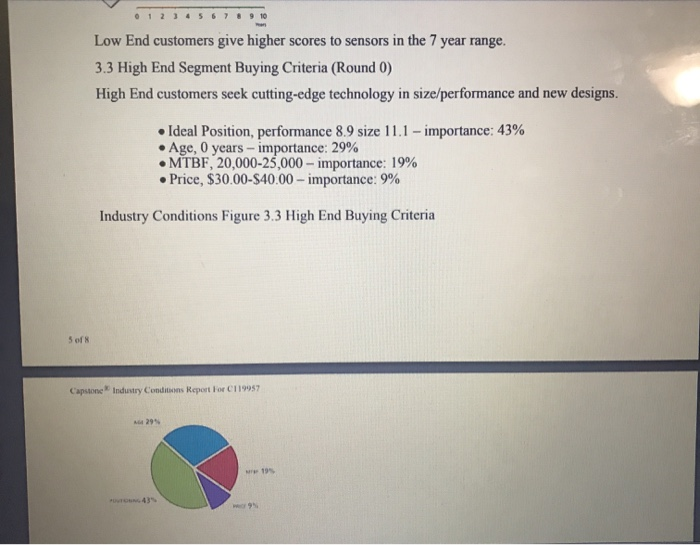
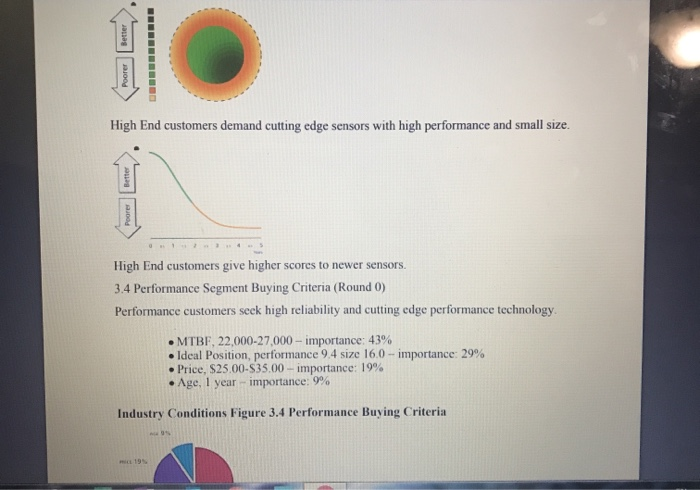
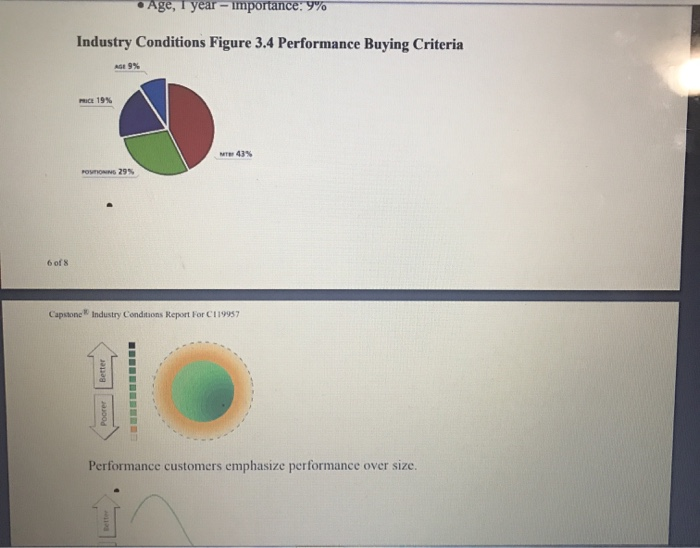
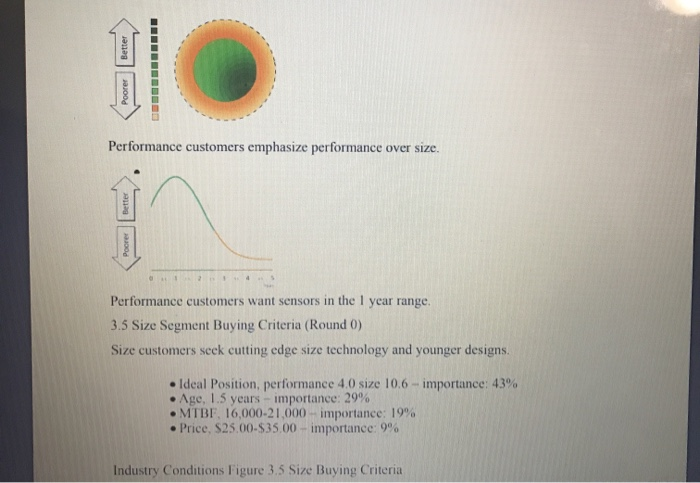
Industry Demand Activity For your purposes, complete the form below with the average" scenario. Assume the Round 1 growth rates will continue into the future unchanged This will give you some idea for potential market size. If you have time, try a worst case and best case scenario for Rounds 2 through 8. For worst case, assume, say, half the growth rate. For best case assume, say, 15 times the growth rate Use the information in the Courier to calculate the Round 1 demand for each of the segments. Once you have successfully entered the correct demand for Rounds 0 and 1, then the rest of the table will fill automatically, Incomplete Traditional Rnd Demand Rate (%) Low End Rnd Demand Rate (%) High End Rnd Demand Rate (%) 0 Performance Rnd Demand Rate (%) Size Rnd Demand Rate (%) 0 D 0 0 1 1 1 1 2 2 2 2 2 3 3 3 3 3 4 4 4 4 5 5 5 5 5 6 6 7 7 7 7 Calculating Market Demand The Industry Demand Analysis will help the Marketing and Production Departments understand future demand, Marketing can use the total demand for each segment as it creates a sales forecast Production can use the results when making capacity buy and sell decisions. You will need: The Segment Analysis reports (pages 5-9) of the Capstone Courier for Round 0 The Industry Conditions Report At the top of each Segment Analysis page you will find each segment's statistics (sve example below). The top line is the total demand for the segment for last year (the Courier reports last years data) The fourth line tells you next years growth rate for the segment To find out the coming years total demand, simply apply the growth rate to last years total demand, High End Segment Analysis CSU For example, in the High End segment analysis on the left. Total Demand is 2554 and next years growth rate is 16.2% Next years demand is calculated as follows: High End Statistics Total Industry Unit Demand Actual Industry Unit Sales Segment of Total Industry 2.554 2554 112 Total demand 2554 + Growth (Total Demand x 16.2%) 414 Next Year's Segment Growth Rata 102 The above growth and demand figures are for example only. Your industry Total Seament Demand next vear ( CAPS High End Segment Analysis COU For example, in the High End segment analysis on the left, Total Demand is 2554 and next years growth rate is 16.2% Next years demand is calculated as follows: High End Statistics Total Industry Unit Demand Actual Industry Unit Sales Segment of Total Industry 2554 2,554 11.2% Total demand 2554 + Growth (Total Demand x 16.2%) 414 Next Year's Segment Growth Rate 16.2% * The abowe growth and demand figures are for example only. Your industry growth rates and demand may differ, but the process to calculate next years total segment demand is identical Total Segment Demand next year (rounded to nearest whole number) 2968 Industry Demand Activity For your purposes, complete the form below with the average scenario. Assume the Round 1 growth rates will continue into the future unchanged. This will give you some idea for potential market size if you have time try a worst case and best case scenario for Rounds 2 through 8. For worst case, assume say half the growth rate For best case assume say, 15 times the growth rate Use the information in the Courier to calculate the Round 1 demand for each of the segments. Once you have successfully entered the correct demand for Rounds and then the rest of the table will automatically Incomplete While you can calculate the demand for Round 1 from the information on hand future growth rates are unknown. Can you predict the market size for Rounds 2 to 8? No On the other hand, you need something for planning purposes to address critical questions like: How much production capacity will we need in the future? How much money do we need to raise? Which segments are most attractive for investment? Planners address this type of issue with scenarios. Typically there are three worst case, average case, and best case. The average case assumes that the current growth continues indefinitely into the future. Worst case assumes a lower growth rate. Best case a higher growth rate The truth will unfold as the simulation progresses. Next year's growth rate is published in the Courier on each Segment page in the Statistics Box CAPSTONE. Round: 0 Dec. 31, 2020 Andrews COURIER C119957 Baldwin Chester Digby Erie Ferris ROS Asset Turnover ROA Leverage ROE Emergency Loan Sales EBIT Profits Cumulative Profit SG&A / Sales Contrib. Marain Andrews 4.1% 1.05 4.4% 2.0 8.7% $0 $101,073,437 $11.996,365 $4,188,507 $4,188,507 8.9% 28.39% Selected Financial Statistics Baldwin Chester Digby 4.1% 4.1% 4.1% 1.05 1.05 1.05 4.4% 4.4% 4.4% 2.0 2.0 20 8.7% 8.7% 8.7% SO $O SO $101,073,437 $101,073,437 $101,073.437 $11.996,365 $11.996,365 $11.996,365 $4,188,507 $4,188,507 $4,188,507 $4,188,507 $4,188,507 $4,188,507 8.9% 8.9% 8.9% 28.3% 28.3% 28.3% Erle 4.1% 1.05 4.4% 2.0 8.7% $0 $101,073,437 $11.996,365 $4,188,507 $4,188,507 89% 28.39 Ferris 4.1% 1.05 4.4% 2.0 8.7% $0 $101,073,437 $11.996,365 $4,188,507 $4,188,507 8.9% 28.3% ROS Asset Turnover ROA Leverage ROE Emergency Loan Sales EBIT Profits Cumulative Profit SG&A / Sales Contrib. Margin% Andrews 4.1% 1.05 4.4% 20 8.7% $0 $101,073,437 $11.996,365 $4,188,507 $4,188,507 8.9% 28.3% Baldwin 4.1% 1.05 4.4% 20 8.7% $0 $101,073,437 $11.996,365 $4,188,507 $4,188,507 8.9% 28.3% Chester 4.1% 1.05 4.4% 2.0 8.7% $0 $101,073,437 $11.996, 365 $4,188,507 $4,188,507 8.9% 28.3% Digby 4.1% 1.05 4.4% 2.0 8.7% $0 $101,073,437 $11,996,365 $4,188,507 $4,188,507 8.9% 28.3% Erle 4.1% 1.05 4.4% 2.0 8.7% $0 $101,073,437 $11.996,365 $4,188,507 $4,188,507 8.9% 28.3% Ferris 4.1% 1.05 4.4% 2.0 8.7% $0 $ 101,073,437 $11.996,365 $4,188,507 $4,188,507 8.9% 28.3% Percent of Sales C119957 $ Market Share C119957 100% 90%. 80% 70% 60% 50% O Var Cost Depr O SGA Other O Profit 30%. 20% Andrews Baldwin Chester O Digby Ere Ferris 16.67% 16.67% 16.67% 16.67% 16.67% 16.67% Andrews Chester Digby Ere Ferris CAPSTONE COURIER Page 1 CAPSTONE Stock & Bonds COURIER C119957 Round: 0 Dec. 31, 2020 Company Andrews Baldwin Chester Digby Yield 5.8% Close $34.25 $34.25 $34 25 $34.25 $34.25 $34 25 Stock Market Summary Change Shares Marketcap Book Value (SM) Per Share $0.00 2,000,000 $69 $23.97 $0.00 2,000,000 $69 $23.97 $0.00 2,000,000 $69 $23.97 $0.00 2,000,000 $69 523 97 $0.00 2,000,000 $69 $23.97 50.00 2,000,000 $09 $23.97 Closing Stock Price C119957 EPS $209 $2.09 $2.09 $2.09 $2.09 $2.09 Dividend $2.00 $2.00 $2.00 $2.00 $2.00 $2.00 PIE 16.4 16.4 16.4 16.4 16.4 164 5.8% 5.8% 5.8% 5.8% 5.8% Ere Ferris 550 $40 Andrews O Baldwin Chester Digby Ere Fans 530 $20 510 SO 2020 2021 2022 2023 2024 2025 2026 2027 2028 Series Face YIL Company Andrews Yield Closes SAP 11.052022 $6.950.000 12.552024 $13.900.000 14.05.2020 $20.850,000 Bond Market Summary Closes S&P Company Series# Face Digby 99.49 B 11.082022 56.050.000 103.70 B 12.592024 $13,900,000 111.32 B 14.0S2020 $20,850,000 Ere B 11.052022 $6.950,000 103.70 B 12 552024 $13.000.000 12.15 12.6% 11.1% 12.1% 12.6% 99.49 103.70 B B Baldwin 111.32 11.052022 $6,950,000 12.552024 $13.900.000 11:19 12.15 B 11.15 12.1 39.49 103.70 Series FACE Yield Yield Ciosos S&P Company Andrews Bond Market Summary Closes S&P Company Sorles Face Digby 99.49 B 11.0S2022 $6,950,000 103.70 B 12.5S2024 $13,900,000 111.32 B 14.0S2026 $20,850,000 11.0S2022 $6,950,000 12.582024 $13,900,000 14.0S2026 $20,850,000 11.1% 12.1% 12.6% 11.1% 12.1% 12.6% 99.49 103.70 111.32 B B Baldwin Erle B 11.0S2022 $6.950,000 12.5S2024 $13,900,000 14.0S2026 $20,850,000 11.1% 12.1% 12.6% 99.49 103.70 111.32 B B B 11.0S2022 $6.950,000 12.5S2024 $13,900,000 14.0S2026 $20,850,000 11.1% 12.1% 12.6% 99.49 103.70 111.32 B Chester Ferris 11.082022 $6,050,000 12.552024 $13,900,000 14.0S2026 $20,850,000 11.1% 12 19 12.6% 99.40 103.70 111.32 B B B 11.05.2022 $6,950,000 12 552024 $13.900.000 14.0S2026 $20,850,000 11.1% 12.1% 12.6% 99.49 103.70 111.32 B B B Next Year's Prime Rate 7.00% CAPSTONE COURIER Page 2 CAPSTONE Financial Summary COURIER C119957 Round: 0 Dec. 31, 2020 Erla Forris Andrews Baldwin Chester Digby 54.189 $4,189 54.189 $4,189 $4.189 $4,189 $7,587 Cash Flow Statement Survey CashFlows from operating activities Net Income (LOS) Adjustment for non-cash items: Depreciation Extraordinary gains/losses/writeoffs Changes in current assets and liabilities Accounts payable Inventory Accounts Receivable Net cash from operations $7,587 $0 $7,587 $0 $7,587 $0 $7,587 $0 $7.587 $0 $3,583 (58.617) (5307) $6,434 $3,583 (58.617) ($307) $6,434 $3,583 (58,617) ($307) $8.434 $3,583 (58,617) ($307) $6.434 $3,583 (58.617) ($307) $6,434 $3,583 (58,617) ($307) $6,434 $0 $0 $0 $0 SO SO Cash flows from investing activities Plant improvements(net) Cash flows from financing activities Dividends paid Sales of common stock Purchase of common stock Cash from long term debt issued Early retirement of long term debt Retirement of current debt Cash from current debt borrowing Cash from emergency loan Net cash from financing activities Net change in cash position Balance Sheet Survey Cash Accounts Receivable Inventory Total Current Assets (54.000) 50 $0 $0 50 50 $0 50 ($4,000) SO SO SO $0 $0 $0 SO ($4,000) $0 SO SO SO SO SO $0 ($4.000) $0 $0 $0 $0 $0 SO $0 (54.000) $0 SO $0 $0 $0 SO SO ($4,000) SO SO $0 $0 $0 $0 $0 ($4.000) ($4.000) (54,000) (54.000) $2.434 Andrews $3.434 $8,307 $8,617 $20,358 $2.434 Baldwin $3,434 $8.307 $8.617 $20.358 ($4,000) $2.434 Chester $3,434 $8,307 $8,617 $20.358 $2,434 Digby $3.434 $8.307 58,617 $20.358 (54.000) $2.434 Erie $3,434 $8.307 $8,617 $20.358 $2.434 Ferris $3,434 $8.307 58,617 $20,358 Plant and equipment Accumulated Depreciation Total Fixed Assets $113.800 ($37.933) $75.867 $113.800 (837933) $75.867 $113,800 ($37.933) $75,867 $113,800 ($37.933) $75,867 $113.800 ($37.933) $75.867 $113.800 (537.933) $75.867 Total Assets S06.225 596.225 596.225 $96.225 $96.225 S96,225 Accounts Payable 56,583 $6,583 56,583 $6,583 $8.583 $6,583 Net change in cash position Balance Shoot Survey Cash Accounts Receivable Inventory Total Current Assets $2,434 Andrews $3,434 $8,307 $8,617 $20,358 $2,434 Baldwin $3,434 $8,307 $8,617 $20,358 $2,434 Chester $3,434 $8,307 $8,617 $20.358 $2,434 Digby $3,434 $8,307 $8,617 $20,358 $2,434 Ere $3,434 $8,307 $8,617 $20,358 $2.434 Ferris $3,434 $8,307 $8.617 $20.358 Plant and equipment Accumulated Depreciation Total Fixed Assets $113,800 ($37.933) $75,867 $113,800 ($37,933) $75,867 $113,800 ($37,933) $75,867 $113,800 ($37,933) $75,867 $113,800 ($37.933) $75,867 $113,800 ($37,933) $75,867 Total Assets $96.225 $96.225 $96,225 $96.225 $96,225 $96.225 Accounts Payable Current Debt Total Current Liabilities Long Term Debt Total Liabilities $6,583 SO $6,583 $6,583 SO $6,583 $6,583 $0 $6,583 $6,583 $0 $6,583 $6,583 $0 $6,583 $6.583 SO $6,583 $41,700 $48.283 $41.700 $48.283 $41.700 $48,283 $41.700 $48,283 $41.700 $48,283 $41,700 $48,283 Common Stock Retained Earnings Total Equity $18,360 $29.582 $47.942 $18.360 $29.582 $47,942 $18,360 $29,582 $47.942 $18,360 $29.582 $47.942 $18,360 $29,582 $47.942 $18,360 $29,582 $47.942 Total Liabilities & Owners Equity $96.225 $96.225 $96,225 $96.225 $96.225 $96.225 Income Statement Survey Sales Variable Costs(Labor Material Carry) Contribution Margin Depreciation SGA(R&D Promo, Sales Admin) Other(Fees, Writeoffs.TOM.Bonuses) EBIT Interest(Short term Long term) Taxes Profit Sharing Net Profit CAPSTONE COURIER Andrews $101.073 $72.513 $28.560 $7.587 $8.978 SO $11.996 $5.421 52 301 $85 $4.189 Baldwin $101.073 $72.513 $28,560 $7.587 $8.978 SO $11.996 $5.421 $2.301 $85 $4,180 Chester $101,073 $72,513 $28.560 $7,587 $8.978 $0 $11.996 $5,421 52.301 $85 $4.189 Digby $101,073 $72,513 $28,560 $7,587 $8.978 $0 $11.996 $5.421 $2.301 $85 $4,189 Erio $101,073 $72,513 $28,560 $7.587 $8.978 $0 $11.996 $5.421 $2.301 sas $4.189 Ferris $101,073 $72,513 $28,560 $7.587 $8.978 $0 $11.996 $5,421 $2.301 $85 $4.189 Page 3 Production Analysis CAPSTONE COURIER C119957 Round: 0 Dec. 31, 2020 Production Vs. Capacity C119957 Andrews Baldwin Chester Digby Ere Ferris O 500 1.000 1.500 2.000 Capacity 2.500 3.000 3.500 4.000 4.500 5.000 O Production Auto Primary Segment Tead Capacity Next Unte Sold 900 1,750 360 350 Cos 3116 Cos 3749 AB Acre Adam A Age Band and SA Over time ON 0 09 Contr. Mara 20% 27 33% 2 30 Next Round 40 SO 30 30 30 pen $15.9 $15.87 $13.62 1.800 1600 900 600 5857 3857 5857 ON 129 45% 735 635 Pie 000 Bar Trad Low High 000 C'S des 36 Bid Bold Bundy USE Unt Inven Revision Age Prim Se Date Decl MTBF CoordCoord Pro 189 11/21/2017 3.1 17500 55 145 20.00 392/2016 46 000 3.0 170 21.00 40 10 2019 1.7 25000 BO 120 33.00 78/3/2018 25 25000 15.5 $33.00 25/25/2018 2019000 40 110.00 180 11/21/2017 3.1 17300 55 14512800 30242010 40 16000 30 170 52100 404/10/2010 23000 80 120 00 78 2018 25 25000 15.5 333.00 62 W29/2018 28 000 110 3300 112.2011 2.1 5200 30/2010 40 14000 170 21.00 402010 17 25000 30 1200 730/2018 2.525000 24 55 $300 20 10000 40 110 3100 189 112.2017 31 17500 55 14.5328.00 39 2016 110 21.00 40 411 2010 86 262000 94 1550 $11.50 3740 5781 $15.9 31587 857 5857 2014 27 30 225 30N ON SON ON RE|| 40 50 30 30 30 Site 1400 900 600 000 1299 45 73 S3N 999 Tras Low eg SS DE Cake Code Cid Coat 57.49 $7.12 40 100 99 09 use it 511.50 378 315 3157 3130 30 10 10 1.400 200 000 600 $8.57 ON NO Dan Tras 60 29 High Pm 1150 149 1781 515 867 31587 1857 40 1800 50 1,400 10 3000 45 30 ON SEE VEL CAPSTONE Traditional Segment Analysis COURIER C119957 Round: 0 Dec. 31, 2020 Accessibility C119957 Traditional Traditional Statistics Total Industry Unit Demand Actual Industry Unit Sales Segment % of Total Industry 7,387 17,387 132.4% Andrews Baldwin Chester Digby Erie Ferris Next Year's Segment Growih Rale 16.7% Traditional Customer Buying Criteria Expectations Importance 1. Age Ideal Age = 20 47% 2. Price $20.00 - 30.00 23% 3. Ideal Position Pfmn 5.0 Size 15.0 21% 4. Reliability MTBF 14000-19000 9% Perceptual Map for Traditional Perceptual map (at end of this year) 20 60 1024 Actual vs Potential Market Share 2020 C119957 Traditional 18 16% G 10 14 12 10% 8. Site Andrews Fotenta 4 6 8 10 12 14 16 18 20 O Actu Performance Top Products in Traditional Segment Actual Potential Performance Name Able Baker Cake Daze Eat Fast Acre Bead Cedar Dell Ebb Feat Market Share 13% 13% 13% 13% 13% 13% 4% 4% UNS Sold to Seg 961 961 961 961 961 961 270 270 270 270 270 270 Revision Date 11/21/2017 11/21/2017 11/21/2017 11/21/2017 11/21/2017 11/21/2017 5/24/2016 5/24/2016 5/24/2016 5/24/2016 5/24/2016 5/24/2016 Top Products in Traditional Segment Cust Stock Pimn Size List Age Promo Aware- Out Coord Coord Price MTBF Dec.31 Budget Dess 5.5 14.5 $28.00 17500 3.10 $1,000 55% 5.5 14.5 $28.00 17500 3.10 $1,000 55% 5.5 14.5 $28.00 17500 3.10 $1,000 55% 5.5 14.5 $28.00 17500 3.10 $1,000 55% 5.5 14.5 $28.00 17500 3.10 $1,000 55% 5.5 14.5 $28.00 17500 3.10 $1,000 55% 3.0 17,0 $21.00 14000 4.60 $900 3.0 17.0 $21.00 14000 4.60 $900 52% 3.0 17,0 $21.00 14000 4.60 $900 52% 3.0 17,0 $21.00 14000 4.60 $900 52% 3.0 17.0 $21.00 14000 4.60 $900 52% 3.0 17,0 $21.00 14000 4.60 $900 52% Cust Sales Access Budget ibility $1,000 54% $1,000 54% $1,000 54% $1,000 54% $1,000 54% $1,000 54% $900 54% $900 54% $900 54% $900 54% $900 54% $900 54% Dec Cust Survey 18 18 18 18 18 18 4 4 4 52% 4% 4% + CAPSTONE COURIER Page 5 Round: 0 Dec. 31, 2020 CAPSYONE Low End Segment Analysis COURIER C119957 Low End Statistics Accessibility C119957 Low End Total Industry Unit Demand 8.960 Actual Industry Unit Sales 18.960 Andreas Segment of Total Industry 39.3% Next Year's Segment Growih Rate 13.8% Creste Name Acre Bead Cedar Dell Ebb Feat Market Share 17% 17% 17% 17% 17% 17% UNIS Sold to Seg 1,493 1,493 1,493 1,493 1,493 1.493 Revision Date 5/24/2016 5/24/2016 5/24/2016 5/24/2016 524/2016 5/24/2016 Top Products in Low End Segment Cust Stock Pimn Size List Age Promo Aware- Out Coord Coord Price MTBF Dec 31 Budget Dess 3.0 17,0 $21.00 14000 4.60 $900 52% 3.0 17,0 $21.00 14000 4.60 $900 52% 30 17.0 $21.00 14000 4.60 $900 52% 3.0 17,0 $21.00 14000 4.60 $900 52% 3.0 17,0 $21.00 14000 $900 52% 3.0 17,0 $21.00 14000 4.60 $900 52% CUSI. Dec Sales Access Cust Budgetibility Survey $900 40% 12 $900 40% 12 $900 40% 12 $900 40% 12 $900 40% 12 $900 40% 12 4.60 CAPSTONE COURIER Page 6 Round: 0 Dec. 31, 2020 CAPSTONE High End Segment Analysis COURIER C119957 High End Statistics Accessibility C119957 High End Total Industry Unit Demand 2.554 Actual Industry Unit Sales 2.554 Andrews Segment of Total Industry 111.2% BG Next Year's segment Growth Rita 120.2% Cheste High End Customer Buying Criteria Expectations Importance OD Round: 0 Dec. 31, 2020 CAPSTONE High End Segment Analysis COURIER C119957 High End Statistics Accessibility C119957 High End Total Industry Unit Demand 2,554 Andrews Actual Industry Unit Sales 12.554 Segment % of Total Industry 111.2% Baldwin Next Year's Segment Growth Rate 120.2% Chester High End Customer Buying Criteria Digby Expectations Importance Ere 1. Ideal Position Pfmn 8.9 Size 11.1 43% 2. Age Ideal Age=0.0 29% Ferris 3. Reliability MTBF 20000-25000 19% 4. Price $30.00 - 40.00 9% Perceptual Map for High End Actual vs Potential Market Share Perceptual map (at end of this year) 20 2020 C 119957 High End 904 18 18 14% 4 129. 12 3. Size 10 8 4. : 8 10 12 14 16 18 20 0 Actual Potenta Performance Top Products in High End Segment Units Cust Cust Dec Top Products in High End Segment Stock Out 48% Name Adam Bid Cid Dixie Echo Fist Ant Bold Coat Dot Edge Foam $800 Market Share 14% 14% 14% 14% 14% 14% 2% 2% 2% 2% 2% 2% Unis Sold to Seg 366 366 366 366 366 366 41 41 41 41 41 41 Revision Date 4/19/2019 4/19/2019 4/19/2019 4/19/2019 4/19/2019 4/19/2019 6/30/2018 6/30/2018 6/30/2018 6/30/2018 6/30/2018 6/30/2018 Pfmn Coord 8.0 8.0 8.0 80 80 80 9.4 9.4 Cust. Size List Age Promo Aware- Coord Price MTBF Dec.31 Budget ness 12.0 $38.00 23000 1.70 $800 49% 120 $38.00 23000 1.70 $800 49% 12.0 $38.00 23000 1.70 $800 49% 12.0 $38.00 23000 1.70 $800 49% 120 $38.00 23000 1.70 $800 49% 120 $38.00 23000 1.70 $800 49% 15.5 $33.00 25000 2 50 $700 46% $33.00 25000 250 $700 46% 15.5 $33.00 25000 250 $700 46% 15.5 $33.00 25000 2.50 $700 46% 15.5 $33,00 25000 2.50 $700 46% 15.5 $33.00 25000 2.50 $700 46% Cust DEC Sales Access Cust Budgetibility Survey $800 48% 21 $800 21 $800 48% 21 48% 21 $800 48% 21 $800 48% 21 $700 48% 2 $700 48% 2 $700 48% 2 $700 48% 2 $700 48% 2 $700 48% 15.5 9.4 9.4 CAPSTONED COURIER Page 7 CAPSTONE Performance Segment Analysis COURIER C119957 Round: 0 Dec. 31, 2020 Accessibility C 119957 Performance Performance Statistics Total Industry Unit Demand Actual Industry Unit Sales Segment of Total Industry Andrews 1,915 11.915 18.4% Biswa Next Year's Segment Growth Rata 116.0% Performance Customer Buying Criteria Expectations Importance Chese Dob E Round: 0 Dec. 31, 2020 11.915 CAPSTONE Performance Segment Analysis COURIER C119957 Performance Statistics Accessibility C119957 Performance Total Industry Unit Demand 1.915 Andrews Actual Industry Unit Sales Segment % of Total Industry 18.4% Baldwin Next Year's Segment Growth Rate 116.9% Chester Performance Customer Buying Criteria Digby Expectations Importance Ene 1. Reliability MTBF 22000-27000 43% 2. Ideal Position Pfmn 9.4 Size 16.0 29% Ferris 3. Price $25.00 - 35.00 19% 4. Age Ideal Age - 1.0 9% Perceptual Map for Performance Actual vs Potential Market Share Perceptual map (at end of this year) 2020 C119957 Performance 20 18 16". 10 14 12. 10 S 12 Sure 10 2 4 6 8 10 12 14 16 18 20 Performance Actu - Fotents 94 Name AN Bold Coat Dot Edge Foam Able Baker Cake Daze Eat Fast Market Share 17% 17% 17% 17% 17% 17% 0% 0% 0% 0% 0% 0% Units Sold to Seg 317 317 317 317 317 317 2 2 2 2 2 2 Revision Date 6/30/2018 6/30/2018 6/30/2018 6/30/2018 6/30/2018 6/30/2018 11/21/2017 11/21/2017 11/21/2017 11/21/2017 11/21/2017 11/21/2017 Top Products in Performance Segment CUSE Stock Pfmn Size List Age Promo Aware- Out Coord Coord Price MTBF Dec 31 Budget 94 15.5 $33.00 25000 250 $700 46% 9.4 15.5 $33.00 25000 2.50 $700 46% 15.5 $33.00 25000 2.50 $700 40% 9.4 15.5 $33.00 25000 2.50 $700 46% 9.4 15 5 $33.00 25000 250 $700 46% 9.4 15.5 $33.00 25000 2 50 $700 46% 5.5 14.5 $28.00 17500 3.10 $1,000 55% 5.5 14,5 $28.00 17500 3.10 $1,000 55% 5.5 14.5 $28.00 17500 3.10 $1,000 56% 5.5 14.5 $28.00 17500 3.10 $1,000 55% 5.5 14.5 $28.00 17500 3.10 $1,000 55% 5.5 14.5 $28.00 17500 3.10 $1,000 55% Cust DEC Sales Access Cust Budgetibility Survey $700 37% 20 $700 37% 20 $700 37% 20 $700 37% 20 $700 37% 20 $700 37% 20 $1.000 37% 0 $1,000 37% 0 $1,000 37% 0 $1,000 37% 0 $1.000 37% 0 $1,000 37% 0 CAPSTONEO COURIER Page 8 CAROTONI Size Segment Analysis COURIER C119957 Round: 0 Dec. 31, 2020 Accessibility C119957 Size Size Statistics Total Industry Unit Demand Actual Industry Unit Sales Segment of Total Industry Ar 1,984 11.984 18.75 115.0 Next Years Segment Growi RM Size Customer Buying Criteria CAPSTONE Size Segment Analysis COURIER C119957 Round: 0 Dec. 31, 2020 Accessibility C119957 Size Size Statistics Total Industry Unit Demand Actual Industry Unit Sales Segment % of Total Industry Andrews 1,984 11.984 18.7% Baldwin Chester Digby Ere Ferris Next Year's Segment Growth Rale 115.9% Size Customer Buying Criteria Expectations Importance 1. Ideal Position Pimn 4.0 Size 10.6 43% 2. Age Ideal Age 1.5 29% 3. Reliability MTBF 10000 21000 19% 4. Price $25.00 - 35.00 9% Perceptual Map for Size Perceptual map (at end of this year) 20 SM Actual vs Potential Market Share 2020 C 119957 Size 18 18% 10 14 12 Sure 10 8 4. 4 09 8 10 12 14 18 20 Potential And Bal 0 0 2 CUSE Market Share 15% 15% 15% 15% 5 8 10 12 14 16 18 20 Actual Potential Performance Top Products in Size Segment Uns Cust. Sold to Revision Stock Pimn Size List Age Promo Aware Sales Access Seg Date Out Coord Coord Price MTBF Dec 31 Budget ness Budgetibility 307 5/25/2018 4.0 11.0 $33.00 19000 2.60 $700 46% $700 42% 307 5/25/2018 4.0 11.0 $33.00 19000 2.60 $700 46% $700 42% 307 5/25/2018 4.0 11,0 $33.00 19000 2.60 $700 46% $700 42% 307 5/25/2018 40 11.0 $33.00 19000 260 $700 46% $700 42% 307 5/25/2018 4.0 11.0 $33.00 19000 2.60 $700 46% $700 42% 307 5/25/2018 40 11.0 $33.00 19000 2.60 $700 46% $700 42% 24 11/21/2017 5.5 14.5 $28.00 17500 3.10 $1,000 55% $1,000 42% 24 11/21/2017 5.5 14,5 $28.00 17500 3.10 $1,000 55% $1,000 42% 24 11/21/2017 5.5 14.5 $28.00 17500 3.10 $1,000 55% $1,000 24 11/21/2017 5.5 14.5 $28.00 17500 3.10 $1,000 55% $1.000 42% 24 11/21/2017 5.5 14.5 $28.00 17500 3.10 $1,000 55% $1,000 42% 24 11/21/2017 5.5 14.5 $28.00 17500 3.10 $1,000 55% $1.000 42% Name Agape Buddy Cure Dune Egg Fume Able Baker Cake Daze Eat Fast 15% Dec Cust Survey 27 27 27 27 27 27 2 2 2 2. 2 2 15% 1% 1% 1% 15 1% CAPSTONED COURIER Page 9 CAPSTONE Market Share COURIER C119957 Round: 0 Dec. 31, 2020 Units Sold vs Demand Chart C119957 Market Share C 119957 159 10. CAPSTONE Market Share C119957 Round: 0 Dec. 31, 2020 Units Sold vs Demand Chart C119957 Market Share C119957 8.000 6.000 15% 10% 5% 4.000 2.000 Andrews Balduin Chester Digby 0 Trad Low High Pfmn Sice Industry Unit Sales Total Unit Demand Trad Low O High O Pimn O Sce Actual Market Share in Units Potential Market Share in Units Trad Low High Plan Suze Total Trad Low High Pfmn Size Total Industry Unt Sales 7.387 8.900 2,564 1.915 1.084 22.800 unts Derranded 7:37 8.000 2.554 1.915 1.984 22.800 of Market 32.45 30 31 112 8.4% 8.7% 100.0% of Market 32.4% 30.3% 11.25 84% 8.75 100.0% Able 13.09 04 0.15 12% 44% Able 13.0 0.5% 12 44% Acre 167 7.7 Acre 3.7% 16,7% Adam 1439 7.7% 1.6% Adam 143 1.6% All 1.6% 16:59 1.6% AM 1.6% 16.5% 1.6% Agape O 3N 15.5% 1.4% Agape 0.3% 15.5% 14% Total 16.7 16.7 16.7% 16.7% 16.79 16.7% Total 16.7% 16.7 16.7 16.75 16.7% 16.7% 130% 04 0.1% 1.2% 44% Baker 13.0% Bead 3.6% 0.5% 12% 16.7 7.7% Bead 3.7% 16,7% 7.7% Bid 1439 1.6% Bid 143 1.69 Bold 1.0 165 1.6% Bold 1.6% Buddy 16.5% 0.3% 16% 15.5% 1.4% Buddy 0.3% 15.5% 1.4% Total 16.7% 16.7% 16.7% 16.7% 16.7 16.7% TO 16.7% 16,7% 18.7% 16.7% 1879 107% Cake 13.04 0.1% 1.25 4.4% Cake 13.0% 0.5% 1.246 4.4% Cedar 30 16.7 7.7% Cedar 3.7% 10.7 Cd 143 7.7% 1.6% Cid Coat 14.3% 1.6% 1.8% 16.5 1.6% Coat Cure 10% 1659 1.6% 0.3 15 594 141 Cure 0.3% 1.4N Tot 16.7% 155 16.7% 16.7% 16.7 16796 16.7% Total 16.7% 1679 16.7% 16.7% 16.7 16.7 Daze 13.0 0.49 0.14 12 44% Daze 13.04 0.5N 3.6% 16.7% 7.7% Dell 3.7% 0.7% 14.3% 1.6% Dwe 7.7 14.3 Dot 1.6% 1.09 16.5% 1.8% Dune 0.34 10 16.6% 1.6% 15.5% 14% Dune Total 16.7 0.39 16.7 10.7 1.45 16.7 10.7 15 5 16.75. To 16.7 16.75 16.7% 167 1879 16.7% CAPSTONE Perceptual Map Round: 0 Dec. 31, 2020 COURIER C119957 Perceptual Map for All Segments Perceptual map (at end of this year) 20 18 Gegar 16 14 12 Size 10 8 6 4 2 0 0 2 4 6 8 10 12 14 16 18 20 Andrews Pimn Name Able Acre Adam AR Agape Size 14.5 17.0 120 155 11.0 3.0 8.0 Revised Name 11/21/2017 Baker 5/24/2016 Bead 4/19/2019 Bd 630/2018 Bold 5/25/2018 Buddy Performance Baldwin Pfmn Siro Revised Name 145 11/21/2017 Cake 30 5/24/2016 Cedar 80 12.0 4/19 2019 Cid 94 155 B/30/2018 Coat 40 110 5/25/2018 Cure 170 Chester Pimn Stre 5.5 145 3.0 80 120 94 15.5 40 110 170 Revised 11/21/2017 5/24/2016 4/19/2019 6/30/2018 5/20/2018 40 Digby Erie Pinn Sie Nama Daze Dell Die Dol Dure Pimn 5.5 3.0 80 94 4.0 Stre 14,5 17.0 120 15 5 110 Revised Name 11/21/2017 Eat 5/24/2016 Ebb 4/19/2019 Echo 6/30/2018 Edge 25/2018 E90 3.0 80 9.4 14.5 17.0 120 155 110 Revised Name 11/21/2017 Fast 5/24/2018 Feat 4/10/2010 Fist 8/30/2018 Foam 22010 Fume Ferris Pin 55 14.5 30 170 8.0 94 15 5 40 110 12.0 Revised 1421/2017 5/24/2016 4/10/2010 630/2018 8/25/2018 CAPSTONE CICOURIER Page 11 HR/TQM Report CSURIER C119957 Round: 0 Dec. 31, 2020 HUMAN RESOURCES SUMMARY Andrew 15 Chester 701 701 701 70D 700 700 Needed Complement Complement Digby 70i 700 Ene 701 700 Fans 701 700 CAPSTONE. HR/TQM Report COURIER C119957 Round: 0 Dec. 31, 2020 HUMAN RESOURCES SUMMARY Digoy 701 700 Andrews 701 700 640 60 0.2% 10.0% 70 0 0 0 100.0% S70 50 50 $70 Baldwin 701 700 640 60 0.2% 10.0% 70 0 $0 0 100.0% $70 $0 $0 $70 Chester 701 700 640 60 0.2% 10.0% 70 0 SO 0 100.0% $70 $0 50 $70 640 60 0.2% 10.0% 70 0 Erie 701 700 640 60 02% 10.0% 70 0 $0 0 100.0% $70 SO 50 $70 Ferris 701 700 640 60 0.2% 10.0% 70 0 $0 0 100.0% $70 $0 SO $70 0 100.0% $70 $0 $0 $70 Needed Complement Complement 1st Shift Complement 2nd Shin Complement Overtime Percent Turnover Rate New Employees Separated Employees Recruiting Spend Training Hours Productivity Index Recruiting Cost Separation Cost Training Cost Total HR Admin Cost Labor Contract Next Year Wages Benefits Proft Shang Annual Raise Starting Negotiation Position Wages Benefits Profit Sharing Annual Raise Ceiling Negotiation Position Wages Benefits Profit Sharing Annual Raise Adjusted Labor Demands Wages Benefits Profit Sharing Annual Raise $21.00 2.500 2.0% 5.0% $21.00 2,500 20% 50% $21.00 2.500 20% 50% $21.00 2,500 20% 50% $21.00 2.500 20% 5.0% $21.00 2.500 20% 5.0% Sicke Dava Celling Negotiation Position Wages Benefits Profit Sharing Annual Raise Adjusted Labor Demands Wages Benefits Profit Sharing Annual Raise Strike Days TQM SUMMARY Baldwin Chester Andrews Digby Ene Ferris Process Mgt Budgets Last Year CPI Systems VendorJIT Quality Initiative Training Channel Support Systems Concurrent Engineering UNEP Green Programs $0 $0 SO SO $0 $0 $0 888888 $0 $0 $0 $0 SO SO $0 SO $0 $0 $0 30 $0 $0 $0 SO $0 SO SO 50 $0 $0 $0 $0 $0 $0 SSSSS $0 $0 $0 $0 $0 $0 88888 SO $0 $0 TOM Budgets Last Year Benchmarking Quality Function Deployment Effort CCE/6 Sigma Training GEMI TOEM Sustainability Initiatives Total Expenditures Cumulative impacts Material Cost Reduction Labor Cost Reduction Reduction R&D Cycle Time Reduction Admin Costs Demand increase 0.00% 0.00% 0.00% 0.00% 0.00% 0.00% 0.00% 0.00% 0.00% 0.00% 0.00% 0.00% 0.00% 0.00% 0.00% 0.00% 0.00% 0.00% 0.00% 0.00% 0.00% 0.00% 0.00% 0.00% 0.00% 0.00% 0.00% 0.00% 0.00% 0.00% CAPSTONE O COURIER Page 12 The sensors your company manufactures are incorporated into the products your customers sell. Your customers fall into five groups which are called market segments. A market segment is a group of customers who have similar needs. The segments are named for the customer's primary requirements and are called: Perceptual map (at end of this year) Size 20 181 Low End Performance 16 Traditional 14 High End 12 Size 10 8 6 4 2. 3 4 5 6 7 8 9 10 11 12 13 14 15 16 17 18 19 20 Drift Rates Each year, the segments drift the length of the hypotenuse of the triangle formed by customers' desire for smaller and faster products. Table 1 Segment Circle Drift Rates: Every year, customers 1 of 8 Capstone Industry Conditions Report For C119957 demand increased performance (Pfmn) and decreased size. Note that the drift rates vary for each segment. Pfmn Size Traditional +0.7 -0.7 Low End +0.5 -0.5 High End +0.9 -0.9 Performance +1.0 -0.7 Size +0.7 -1.0 SD 071 SR IS Pfmn Size Traditional +0.7 -0.7 Low End +0.5 -0.5 High End +0.9 -0.9 Performance +1.0 -0.7 Size +0.7 -1.0 SED Son RDC 0.5 PORCE Segment Centers Table 2 Segment Centers at the End of Each Round: As shown in the Perceptual Map Form above, size is on the vertical axis and performance (Pfmn) is on the horizontal axis. Traditional Low End High End Performance Size Round Pfmn Size Pfmn Size Pfmn Size Pfmn Size Pfmn Size 0 5.0 15.0 2.5 17.5 7.5 12.5 8.0 17.0 3.0 12.0 5.7 14.3 3.0 17.0 8.4 11.6 9.0 16.3 3.7 11.0 2 6.4 13.6 3.5 16.5 9.3 10.7 10.0 15.6 4.4 10.0 7.1 12.9 4.0 16.0 10.2 9.8 110 14.9 5.1 9.0 4 7.8 12.2 4.5 15.5 11.1 8.9 12.0 14.2 5.8 8.0 5 8.5 11.5 5.0 15.0 12.0 8.0 13.0 13.5 6.5 7.0 Table 2 Segment Centers at the End of Each Round: As shown in the Perceptual Map Form above, size is on the vertical axis and performance (Pfmn) is on the horizontal axis. 9.2 Traditional Low End High End Performance Size Round Pfmn Size Pfmn Size Pfmn Size Pfmn Size Pfmn Size 0 5.0 15.0 2.5 17.5 7.5 12.5 8.0 17.0 3.0 12.0 5.7 14.3 3.0 17.0 8.4 11.6 9.0 16.3 3.7 11.0 2 6.4 13.6 3.5 16.5 9.3 10.7 10.0 15.6 4.4 10.0 7.1 12.9 4.0 16.0 10.2 9.8 11.0 14.9 5.1 9.0 4 7.8 12.2 4.5 15.5 11.1 8.9 12.0 14.2 5.8 8.0 5 8.5 11.5 5.0 15.0 12.0 8.0 13.0 13.5 6.5 7.0 6 10.8 5.5 14.5 12.9 7.1 14.0 12.8 7.2 6.0 7 9.9 10.1 6.0 14.0 13.8 6.2 15.0 12.1 7.9 5.0 8 10.6 9.4 6.5 13.5 14.7 5.3 16.0 11.4 8.6 4.0 The information in Table 2 reflects the segment centers at the end of the round. Therefore, the Round 0 positions can be seen as the Round 1 starting positions, Round 2 positions can be seen as the Round 3 starting position, etc. Each month during the simulation year, the segment drifts 1/12th of the distance from the starting position to the ending position. Ideal Spots Table 3 Ideal Spot Offsets: Customers prefer products located this distance from 2 of Cupstone Industry Conditions Report For C119957 the center of the segment circle. Pfmn Size Traditional 0.0 0.0 Low End -0.8 +0.8 High End +1.4 -1.4 Performance +1.4 -1.0 Size +1.0 -1.4 The information in Table 3 shows the Ideal Spot "offsets" or distances from the segment center. The ideal spot is that point where, all other things being equal, demand is highest. It is different from the segment center. Why are some ideal spots ahead of the segment centers? The segments are moving. From a customer's perspective, if they buy a product at the ideal spot, it will still be a cutting edge product when it wears out. 2 Segment Sizes and Growth Rates At the beginning of the simulation, Traditional and Low End sell more units than the high technology segments, High End, Performance and Size. Page 10 of the Capstone Courier, the Market Segment Report, displays total industry sales. Each market segment grows at a different rate. Table 4 lists the beginning segment growth rates for your industry. The growth rates might change from year to year. Check the Segment Analysis reports in the Capstone Courier each round for the upcoming year's growth rates Table 4 Beginning Segment Growth Rates Traditional 6.7% Low End 13.8% Ilinh End 2004 Table 4 Beginning Segment Growth Rates Traditional 6.7% Low End 13.8% High End 20.2% Performance 16.9% Size 15.9% 3 Buying Criteria By Segment These are your products and the primary segments they sell into at the beginning of the simulation. These can change according to your decisions and as the simulation evolves. Eat Traditional Ebb Low End Echo High End Edge Performance Egg Size 3 of Capstone Industry Conditions Report For C119957 The buying criteria for each segment, in order of importance, are displayed below. Positioning and Age score information also display. Passing your cursor over an image will enlarge it. See Chapter 3 of the Team Member Guide for explanations of Positioning, Age. Price and MTBF scores. The buying criteria for each segment, in order of importance, are displayed below. Positioning and Age score information also display. Passing your cursor over an image will enlarge it. See Chapter 3 of the Team Member Guide for explanations of Positioning, Age, Price and MTBF scores. 3.1 Traditional Segment Buying Criteria (Round 0) Traditional customers seek proven products at a modest price. Age, 2 years - importance: 47% Price, $20.00-$30.00 - importance: 23% Ideal Position, performance 5.0 size 15.0 - importance: 21% MTBF, 14.000-19.000 - importance: 9% Industry Conditions Figure 3.1: Traditional Buying Criteria 21% Traditional customers give higher position scores to sensors located in the center of the Sementarale ROSMONNG 21% 9% CE 23% AGE 47% Better Poorer Traditional customers give higher position scores to sensors located in the center of the segment circle Better Poorer 4 Traditional customers give higher scores to sensors in the 2 year range. 3.2 Low End Segment Buying Criteria (Round 0) llevata Traditional customers give higher scores to sensors in the 2 year range. 3.2 Low End Segment Buying Criteria (Round 0) Low End customers seek low prices and well proven products. Price, $15.00-$25.00 - importance: 53% 4 of 8 Capstone Industry Conditions Report For C119957 Age, 7 years - importance: 24% Ideal Position, performance 1.7 size 18.3 - importance: 16% MTBF, 12,000-17,000 - importance: 7% Industry Conditions Figure 3.2 Low End Buying Criteria 16 swood . Better . Poorer Low End customers prefer inexpensive sensors with slower performance and larger size. Better Poorer Low End customers give higher scores to sensors in the 7 year range. 3.3 High End Segment Buying Criteria (Round 0) High End customers seek cutting-edge technology in size/performance and new designs. Ideal Position, performance 8.9 size 11.1 - importance: 43% Age, 0 years - importance: 29% MTBF 20.000-25.000 - importance: 19% Price, $30.00-S40.00 -- importance: 9% Industry Conditions Figure 3.3 High End Buying Criteria 1 2 3 4 5 9 10 Low End customers give higher scores to sensors in the 7 year range. 3.3 High End Segment Buying Criteria (Round 0) High End customers seek cutting-edge technology in size/performance and new designs. Ideal Position, performance 8.9 size 11.1 - importance: 43% Age, 0 years - importance: 29% MTBF, 20,000-25,000 - importance: 19% . Price, $30.00-$40.00 - importance: 9% Industry Conditions Figure 3.3 High End Buying Criteria 5 of Capstone Industry Conditions Report For C119957 29 19 Setter Poorer High End customers demand cutting edge sensors with high performance and small size. High End customers give higher scores to newer sensors. 3.4 Performance Segment Buying Criteria (Round 0) Performance customers seek high reliability and cutting edge performance technology MTBF, 22,000-27,000 - importance: 43% Ideal Position, performance 9.4 size 16.0 - importance: 29% Price, $25.00-$35.00 - importance: 19% Age, 1 year - importance: 9% Industry Conditions Figure 3.4 Performance Buying Criteria Age, 1 year - importance: 9% Industry Conditions Figure 3.4 Performance Buying Criteria AGE 9% PRICE 19% MT 43% FOTOS 295 6 of 8 Capstone Industry Conditions Report For C119957 Poorer Performance customers emphasize performance over size. Better TILBUD Poorer Performance customers emphasize performance over size. etter Poorer 124 Performance customers want sensors in the 1 year range. 3.5 Size Segment Buying Criteria (Round 0) Size customers seek cutting edge size technology and younger designs. Ideal Position, performance 4.0 size 10.6 - importance: 43% Age, 1.5 years - importance: 29% MTBF, 16,000-21.000 - importance: 19% Price, S25.00-$35.00 - importance: 9% Industry Conditions Figure 3.5 Size Buying Criteria Industry Conditions Figure 3.5 Size Buying Criteria s PKH 9% AGE 29% POTIONI 40 Better poorer Size customers emphasize size over performance. 7 of Capstone Industry Conditions Report For C11997 Capstone Industry Conditions Report For C119957 Better Poorer Size customers prefer sensors in the 1.5 year range. 4 Projected Interest Rates Prime Interest Rate Round 1: 7.0% Industry Demand Activity For your purposes, complete the form below with the average" scenario. Assume the Round 1 growth rates will continue into the future unchanged This will give you some idea for potential market size. If you have time, try a worst case and best case scenario for Rounds 2 through 8. For worst case, assume, say, half the growth rate. For best case assume, say, 15 times the growth rate Use the information in the Courier to calculate the Round 1 demand for each of the segments. Once you have successfully entered the correct demand for Rounds 0 and 1, then the rest of the table will fill automatically, Incomplete Traditional Rnd Demand Rate (%) Low End Rnd Demand Rate (%) High End Rnd Demand Rate (%) 0 Performance Rnd Demand Rate (%) Size Rnd Demand Rate (%) 0 D 0 0 1 1 1 1 2 2 2 2 2 3 3 3 3 3 4 4 4 4 5 5 5 5 5 6 6 7 7 7 7 Calculating Market Demand The Industry Demand Analysis will help the Marketing and Production Departments understand future demand, Marketing can use the total demand for each segment as it creates a sales forecast Production can use the results when making capacity buy and sell decisions. You will need: The Segment Analysis reports (pages 5-9) of the Capstone Courier for Round 0 The Industry Conditions Report At the top of each Segment Analysis page you will find each segment's statistics (sve example below). The top line is the total demand for the segment for last year (the Courier reports last years data) The fourth line tells you next years growth rate for the segment To find out the coming years total demand, simply apply the growth rate to last years total demand, High End Segment Analysis CSU For example, in the High End segment analysis on the left. Total Demand is 2554 and next years growth rate is 16.2% Next years demand is calculated as follows: High End Statistics Total Industry Unit Demand Actual Industry Unit Sales Segment of Total Industry 2.554 2554 112 Total demand 2554 + Growth (Total Demand x 16.2%) 414 Next Year's Segment Growth Rata 102 The above growth and demand figures are for example only. Your industry Total Seament Demand next vear ( CAPS High End Segment Analysis COU For example, in the High End segment analysis on the left, Total Demand is 2554 and next years growth rate is 16.2% Next years demand is calculated as follows: High End Statistics Total Industry Unit Demand Actual Industry Unit Sales Segment of Total Industry 2554 2,554 11.2% Total demand 2554 + Growth (Total Demand x 16.2%) 414 Next Year's Segment Growth Rate 16.2% * The abowe growth and demand figures are for example only. Your industry growth rates and demand may differ, but the process to calculate next years total segment demand is identical Total Segment Demand next year (rounded to nearest whole number) 2968 Industry Demand Activity For your purposes, complete the form below with the average scenario. Assume the Round 1 growth rates will continue into the future unchanged. This will give you some idea for potential market size if you have time try a worst case and best case scenario for Rounds 2 through 8. For worst case, assume say half the growth rate For best case assume say, 15 times the growth rate Use the information in the Courier to calculate the Round 1 demand for each of the segments. Once you have successfully entered the correct demand for Rounds and then the rest of the table will automatically Incomplete While you can calculate the demand for Round 1 from the information on hand future growth rates are unknown. Can you predict the market size for Rounds 2 to 8? No On the other hand, you need something for planning purposes to address critical questions like: How much production capacity will we need in the future? How much money do we need to raise? Which segments are most attractive for investment? Planners address this type of issue with scenarios. Typically there are three worst case, average case, and best case. The average case assumes that the current growth continues indefinitely into the future. Worst case assumes a lower growth rate. Best case a higher growth rate The truth will unfold as the simulation progresses. Next year's growth rate is published in the Courier on each Segment page in the Statistics Box CAPSTONE. Round: 0 Dec. 31, 2020 Andrews COURIER C119957 Baldwin Chester Digby Erie Ferris ROS Asset Turnover ROA Leverage ROE Emergency Loan Sales EBIT Profits Cumulative Profit SG&A / Sales Contrib. Marain Andrews 4.1% 1.05 4.4% 2.0 8.7% $0 $101,073,437 $11.996,365 $4,188,507 $4,188,507 8.9% 28.39% Selected Financial Statistics Baldwin Chester Digby 4.1% 4.1% 4.1% 1.05 1.05 1.05 4.4% 4.4% 4.4% 2.0 2.0 20 8.7% 8.7% 8.7% SO $O SO $101,073,437 $101,073,437 $101,073.437 $11.996,365 $11.996,365 $11.996,365 $4,188,507 $4,188,507 $4,188,507 $4,188,507 $4,188,507 $4,188,507 8.9% 8.9% 8.9% 28.3% 28.3% 28.3% Erle 4.1% 1.05 4.4% 2.0 8.7% $0 $101,073,437 $11.996,365 $4,188,507 $4,188,507 89% 28.39 Ferris 4.1% 1.05 4.4% 2.0 8.7% $0 $101,073,437 $11.996,365 $4,188,507 $4,188,507 8.9% 28.3% ROS Asset Turnover ROA Leverage ROE Emergency Loan Sales EBIT Profits Cumulative Profit SG&A / Sales Contrib. Margin% Andrews 4.1% 1.05 4.4% 20 8.7% $0 $101,073,437 $11.996,365 $4,188,507 $4,188,507 8.9% 28.3% Baldwin 4.1% 1.05 4.4% 20 8.7% $0 $101,073,437 $11.996,365 $4,188,507 $4,188,507 8.9% 28.3% Chester 4.1% 1.05 4.4% 2.0 8.7% $0 $101,073,437 $11.996, 365 $4,188,507 $4,188,507 8.9% 28.3% Digby 4.1% 1.05 4.4% 2.0 8.7% $0 $101,073,437 $11,996,365 $4,188,507 $4,188,507 8.9% 28.3% Erle 4.1% 1.05 4.4% 2.0 8.7% $0 $101,073,437 $11.996,365 $4,188,507 $4,188,507 8.9% 28.3% Ferris 4.1% 1.05 4.4% 2.0 8.7% $0 $ 101,073,437 $11.996,365 $4,188,507 $4,188,507 8.9% 28.3% Percent of Sales C119957 $ Market Share C119957 100% 90%. 80% 70% 60% 50% O Var Cost Depr O SGA Other O Profit 30%. 20% Andrews Baldwin Chester O Digby Ere Ferris 16.67% 16.67% 16.67% 16.67% 16.67% 16.67% Andrews Chester Digby Ere Ferris CAPSTONE COURIER Page 1 CAPSTONE Stock & Bonds COURIER C119957 Round: 0 Dec. 31, 2020 Company Andrews Baldwin Chester Digby Yield 5.8% Close $34.25 $34.25 $34 25 $34.25 $34.25 $34 25 Stock Market Summary Change Shares Marketcap Book Value (SM) Per Share $0.00 2,000,000 $69 $23.97 $0.00 2,000,000 $69 $23.97 $0.00 2,000,000 $69 $23.97 $0.00 2,000,000 $69 523 97 $0.00 2,000,000 $69 $23.97 50.00 2,000,000 $09 $23.97 Closing Stock Price C119957 EPS $209 $2.09 $2.09 $2.09 $2.09 $2.09 Dividend $2.00 $2.00 $2.00 $2.00 $2.00 $2.00 PIE 16.4 16.4 16.4 16.4 16.4 164 5.8% 5.8% 5.8% 5.8% 5.8% Ere Ferris 550 $40 Andrews O Baldwin Chester Digby Ere Fans 530 $20 510 SO 2020 2021 2022 2023 2024 2025 2026 2027 2028 Series Face YIL Company Andrews Yield Closes SAP 11.052022 $6.950.000 12.552024 $13.900.000 14.05.2020 $20.850,000 Bond Market Summary Closes S&P Company Series# Face Digby 99.49 B 11.082022 56.050.000 103.70 B 12.592024 $13,900,000 111.32 B 14.0S2020 $20,850,000 Ere B 11.052022 $6.950,000 103.70 B 12 552024 $13.000.000 12.15 12.6% 11.1% 12.1% 12.6% 99.49 103.70 B B Baldwin 111.32 11.052022 $6,950,000 12.552024 $13.900.000 11:19 12.15 B 11.15 12.1 39.49 103.70 Series FACE Yield Yield Ciosos S&P Company Andrews Bond Market Summary Closes S&P Company Sorles Face Digby 99.49 B 11.0S2022 $6,950,000 103.70 B 12.5S2024 $13,900,000 111.32 B 14.0S2026 $20,850,000 11.0S2022 $6,950,000 12.582024 $13,900,000 14.0S2026 $20,850,000 11.1% 12.1% 12.6% 11.1% 12.1% 12.6% 99.49 103.70 111.32 B B Baldwin Erle B 11.0S2022 $6.950,000 12.5S2024 $13,900,000 14.0S2026 $20,850,000 11.1% 12.1% 12.6% 99.49 103.70 111.32 B B B 11.0S2022 $6.950,000 12.5S2024 $13,900,000 14.0S2026 $20,850,000 11.1% 12.1% 12.6% 99.49 103.70 111.32 B Chester Ferris 11.082022 $6,050,000 12.552024 $13,900,000 14.0S2026 $20,850,000 11.1% 12 19 12.6% 99.40 103.70 111.32 B B B 11.05.2022 $6,950,000 12 552024 $13.900.000 14.0S2026 $20,850,000 11.1% 12.1% 12.6% 99.49 103.70 111.32 B B B Next Year's Prime Rate 7.00% CAPSTONE COURIER Page 2 CAPSTONE Financial Summary COURIER C119957 Round: 0 Dec. 31, 2020 Erla Forris Andrews Baldwin Chester Digby 54.189 $4,189 54.189 $4,189 $4.189 $4,189 $7,587 Cash Flow Statement Survey CashFlows from operating activities Net Income (LOS) Adjustment for non-cash items: Depreciation Extraordinary gains/losses/writeoffs Changes in current assets and liabilities Accounts payable Inventory Accounts Receivable Net cash from operations $7,587 $0 $7,587 $0 $7,587 $0 $7,587 $0 $7.587 $0 $3,583 (58.617) (5307) $6,434 $3,583 (58.617) ($307) $6,434 $3,583 (58,617) ($307) $8.434 $3,583 (58,617) ($307) $6.434 $3,583 (58.617) ($307) $6,434 $3,583 (58,617) ($307) $6,434 $0 $0 $0 $0 SO SO Cash flows from investing activities Plant improvements(net) Cash flows from financing activities Dividends paid Sales of common stock Purchase of common stock Cash from long term debt issued Early retirement of long term debt Retirement of current debt Cash from current debt borrowing Cash from emergency loan Net cash from financing activities Net change in cash position Balance Sheet Survey Cash Accounts Receivable Inventory Total Current Assets (54.000) 50 $0 $0 50 50 $0 50 ($4,000) SO SO SO $0 $0 $0 SO ($4,000) $0 SO SO SO SO SO $0 ($4.000) $0 $0 $0 $0 $0 SO $0 (54.000) $0 SO $0 $0 $0 SO SO ($4,000) SO SO $0 $0 $0 $0 $0 ($4.000) ($4.000) (54,000) (54.000) $2.434 Andrews $3.434 $8,307 $8,617 $20,358 $2.434 Baldwin $3,434 $8.307 $8.617 $20.358 ($4,000) $2.434 Chester $3,434 $8,307 $8,617 $20.358 $2,434 Digby $3.434 $8.307 58,617 $20.358 (54.000) $2.434 Erie $3,434 $8.307 $8,617 $20.358 $2.434 Ferris $3,434 $8.307 58,617 $20,358 Plant and equipment Accumulated Depreciation Total Fixed Assets $113.800 ($37.933) $75.867 $113.800 (837933) $75.867 $113,800 ($37.933) $75,867 $113,800 ($37.933) $75,867 $113.800 ($37.933) $75.867 $113.800 (537.933) $75.867 Total Assets S06.225 596.225 596.225 $96.225 $96.225 S96,225 Accounts Payable 56,583 $6,583 56,583 $6,583 $8.583 $6,583 Net change in cash position Balance Shoot Survey Cash Accounts Receivable Inventory Total Current Assets $2,434 Andrews $3,434 $8,307 $8,617 $20,358 $2,434 Baldwin $3,434 $8,307 $8,617 $20,358 $2,434 Chester $3,434 $8,307 $8,617 $20.358 $2,434 Digby $3,434 $8,307 $8,617 $20,358 $2,434 Ere $3,434 $8,307 $8,617 $20,358 $2.434 Ferris $3,434 $8,307 $8.617 $20.358 Plant and equipment Accumulated Depreciation Total Fixed Assets $113,800 ($37.933) $75,867 $113,800 ($37,933) $75,867 $113,800 ($37,933) $75,867 $113,800 ($37,933) $75,867 $113,800 ($37.933) $75,867 $113,800 ($37,933) $75,867 Total Assets $96.225 $96.225 $96,225 $96.225 $96,225 $96.225 Accounts Payable Current Debt Total Current Liabilities Long Term Debt Total Liabilities $6,583 SO $6,583 $6,583 SO $6,583 $6,583 $0 $6,583 $6,583 $0 $6,583 $6,583 $0 $6,583 $6.583 SO $6,583 $41,700 $48.283 $41.700 $48.283 $41.700 $48,283 $41.700 $48,283 $41.700 $48,283 $41,700 $48,283 Common Stock Retained Earnings Total Equity $18,360 $29.582 $47.942 $18.360 $29.582 $47,942 $18,360 $29,582 $47.942 $18,360 $29.582 $47.942 $18,360 $29,582 $47.942 $18,360 $29,582 $47.942 Total Liabilities & Owners Equity $96.225 $96.225 $96,225 $96.225 $96.225 $96.225 Income Statement Survey Sales Variable Costs(Labor Material Carry) Contribution Margin Depreciation SGA(R&D Promo, Sales Admin) Other(Fees, Writeoffs.TOM.Bonuses) EBIT Interest(Short term Long term) Taxes Profit Sharing Net Profit CAPSTONE COURIER Andrews $101.073 $72.513 $28.560 $7.587 $8.978 SO $11.996 $5.421 52 301 $85 $4.189 Baldwin $101.073 $72.513 $28,560 $7.587 $8.978 SO $11.996 $5.421 $2.301 $85 $4,180 Chester $101,073 $72,513 $28.560 $7,587 $8.978 $0 $11.996 $5,421 52.301 $85 $4.189 Digby $101,073 $72,513 $28,560 $7,587 $8.978 $0 $11.996 $5.421 $2.301 $85 $4,189 Erio $101,073 $72,513 $28,560 $7.587 $8.978 $0 $11.996 $5.421 $2.301 sas $4.189 Ferris $101,073 $72,513 $28,560 $7.587 $8.978 $0 $11.996 $5,421 $2.301 $85 $4.189 Page 3 Production Analysis CAPSTONE COURIER C119957 Round: 0 Dec. 31, 2020 Production Vs. Capacity C119957 Andrews Baldwin Chester Digby Ere Ferris O 500 1.000 1.500 2.000 Capacity 2.500 3.000 3.500 4.000 4.500 5.000 O Production Auto Primary Segment Tead Capacity Next Unte Sold 900 1,750 360 350 Cos 3116 Cos 3749 AB Acre Adam A Age Band and SA Over time ON 0 09 Contr. Mara 20% 27 33% 2 30 Next Round 40 SO 30 30 30 pen $15.9 $15.87 $13.62 1.800 1600 900 600 5857 3857 5857 ON 129 45% 735 635 Pie 000 Bar Trad Low High 000 C'S des 36 Bid Bold Bundy USE Unt Inven Revision Age Prim Se Date Decl MTBF CoordCoord Pro 189 11/21/2017 3.1 17500 55 145 20.00 392/2016 46 000 3.0 170 21.00 40 10 2019 1.7 25000 BO 120 33.00 78/3/2018 25 25000 15.5 $33.00 25/25/2018 2019000 40 110.00 180 11/21/2017 3.1 17300 55 14512800 30242010 40 16000 30 170 52100 404/10/2010 23000 80 120 00 78 2018 25 25000 15.5 333.00 62 W29/2018 28 000 110 3300 112.2011 2.1 5200 30/2010 40 14000 170 21.00 402010 17 25000 30 1200 730/2018 2.525000 24 55 $300 20 10000 40 110 3100 189 112.2017 31 17500 55 14.5328.00 39 2016 110 21.00 40 411 2010 86 262000 94 1550 $11.50 3740 5781 $15.9 31587 857 5857 2014 27 30 225 30N ON SON ON RE|| 40 50 30 30 30 Site 1400 900 600 000 1299 45 73 S3N 999 Tras Low eg SS DE Cake Code Cid Coat 57.49 $7.12 40 100 99 09 use it 511.50 378 315 3157 3130 30 10 10 1.400 200 000 600 $8.57 ON NO Dan Tras 60 29 High Pm 1150 149 1781 515 867 31587 1857 40 1800 50 1,400 10 3000 45 30 ON SEE VEL CAPSTONE Traditional Segment Analysis COURIER C119957 Round: 0 Dec. 31, 2020 Accessibility C119957 Traditional Traditional Statistics Total Industry Unit Demand Actual Industry Unit Sales Segment % of Total Industry 7,387 17,387 132.4% Andrews Baldwin Chester Digby Erie Ferris Next Year's Segment Growih Rale 16.7% Traditional Customer Buying Criteria Expectations Importance 1. Age Ideal Age = 20 47% 2. Price $20.00 - 30.00 23% 3. Ideal Position Pfmn 5.0 Size 15.0 21% 4. Reliability MTBF 14000-19000 9% Perceptual Map for Traditional Perceptual map (at end of this year) 20 60 1024 Actual vs Potential Market Share 2020 C119957 Traditional 18 16% G 10 14 12 10% 8. Site Andrews Fotenta 4 6 8 10 12 14 16 18 20 O Actu Performance Top Products in Traditional Segment Actual Potential Performance Name Able Baker Cake Daze Eat Fast Acre Bead Cedar Dell Ebb Feat Market Share 13% 13% 13% 13% 13% 13% 4% 4% UNS Sold to Seg 961 961 961 961 961 961 270 270 270 270 270 270 Revision Date 11/21/2017 11/21/2017 11/21/2017 11/21/2017 11/21/2017 11/21/2017 5/24/2016 5/24/2016 5/24/2016 5/24/2016 5/24/2016 5/24/2016 Top Products in Traditional Segment Cust Stock Pimn Size List Age Promo Aware- Out Coord Coord Price MTBF Dec.31 Budget Dess 5.5 14.5 $28.00 17500 3.10 $1,000 55% 5.5 14.5 $28.00 17500 3.10 $1,000 55% 5.5 14.5 $28.00 17500 3.10 $1,000 55% 5.5 14.5 $28.00 17500 3.10 $1,000 55% 5.5 14.5 $28.00 17500 3.10 $1,000 55% 5.5 14.5 $28.00 17500 3.10 $1,000 55% 3.0 17,0 $21.00 14000 4.60 $900 3.0 17.0 $21.00 14000 4.60 $900 52% 3.0 17,0 $21.00 14000 4.60 $900 52% 3.0 17,0 $21.00 14000 4.60 $900 52% 3.0 17.0 $21.00 14000 4.60 $900 52% 3.0 17,0 $21.00 14000 4.60 $900 52% Cust Sales Access Budget ibility $1,000 54% $1,000 54% $1,000 54% $1,000 54% $1,000 54% $1,000 54% $900 54% $900 54% $900 54% $900 54% $900 54% $900 54% Dec Cust Survey 18 18 18 18 18 18 4 4 4 52% 4% 4% + CAPSTONE COURIER Page 5 Round: 0 Dec. 31, 2020 CAPSYONE Low End Segment Analysis COURIER C119957 Low End Statistics Accessibility C119957 Low End Total Industry Unit Demand 8.960 Actual Industry Unit Sales 18.960 Andreas Segment of Total Industry 39.3% Next Year's Segment Growih Rate 13.8% Creste Name Acre Bead Cedar Dell Ebb Feat Market Share 17% 17% 17% 17% 17% 17% UNIS Sold to Seg 1,493 1,493 1,493 1,493 1,493 1.493 Revision Date 5/24/2016 5/24/2016 5/24/2016 5/24/2016 524/2016 5/24/2016 Top Products in Low End Segment Cust Stock Pimn Size List Age Promo Aware- Out Coord Coord Price MTBF Dec 31 Budget Dess 3.0 17,0 $21.00 14000 4.60 $900 52% 3.0 17,0 $21.00 14000 4.60 $900 52% 30 17.0 $21.00 14000 4.60 $900 52% 3.0 17,0 $21.00 14000 4.60 $900 52% 3.0 17,0 $21.00 14000 $900 52% 3.0 17,0 $21.00 14000 4.60 $900 52% CUSI. Dec Sales Access Cust Budgetibility Survey $900 40% 12 $900 40% 12 $900 40% 12 $900 40% 12 $900 40% 12 $900 40% 12 4.60 CAPSTONE COURIER Page 6 Round: 0 Dec. 31, 2020 CAPSTONE High End Segment Analysis COURIER C119957 High End Statistics Accessibility C119957 High End Total Industry Unit Demand 2.554 Actual Industry Unit Sales 2.554 Andrews Segment of Total Industry 111.2% BG Next Year's segment Growth Rita 120.2% Cheste High End Customer Buying Criteria Expectations Importance OD Round: 0 Dec. 31, 2020 CAPSTONE High End Segment Analysis COURIER C119957 High End Statistics Accessibility C119957 High End Total Industry Unit Demand 2,554 Andrews Actual Industry Unit Sales 12.554 Segment % of Total Industry 111.2% Baldwin Next Year's Segment Growth Rate 120.2% Chester High End Customer Buying Criteria Digby Expectations Importance Ere 1. Ideal Position Pfmn 8.9 Size 11.1 43% 2. Age Ideal Age=0.0 29% Ferris 3. Reliability MTBF 20000-25000 19% 4. Price $30.00 - 40.00 9% Perceptual Map for High End Actual vs Potential Market Share Perceptual map (at end of this year) 20 2020 C 119957 High End 904 18 18 14% 4 129. 12 3. Size 10 8 4. : 8 10 12 14 16 18 20 0 Actual Potenta Performance Top Products in High End Segment Units Cust Cust Dec Top Products in High End Segment Stock Out 48% Name Adam Bid Cid Dixie Echo Fist Ant Bold Coat Dot Edge Foam $800 Market Share 14% 14% 14% 14% 14% 14% 2% 2% 2% 2% 2% 2% Unis Sold to Seg 366 366 366 366 366 366 41 41 41 41 41 41 Revision Date 4/19/2019 4/19/2019 4/19/2019 4/19/2019 4/19/2019 4/19/2019 6/30/2018 6/30/2018 6/30/2018 6/30/2018 6/30/2018 6/30/2018 Pfmn Coord 8.0 8.0 8.0 80 80 80 9.4 9.4 Cust. Size List Age Promo Aware- Coord Price MTBF Dec.31 Budget ness 12.0 $38.00 23000 1.70 $800 49% 120 $38.00 23000 1.70 $800 49% 12.0 $38.00 23000 1.70 $800 49% 12.0 $38.00 23000 1.70 $800 49% 120 $38.00 23000 1.70 $800 49% 120 $38.00 23000 1.70 $800 49% 15.5 $33.00 25000 2 50 $700 46% $33.00 25000 250 $700 46% 15.5 $33.00 25000 250 $700 46% 15.5 $33.00 25000 2.50 $700 46% 15.5 $33,00 25000 2.50 $700 46% 15.5 $33.00 25000 2.50 $700 46% Cust DEC Sales Access Cust Budgetibility Survey $800 48% 21 $800 21 $800 48% 21 48% 21 $800 48% 21 $800 48% 21 $700 48% 2 $700 48% 2 $700 48% 2 $700 48% 2 $700 48% 2 $700 48% 15.5 9.4 9.4 CAPSTONED COURIER Page 7 CAPSTONE Performance Segment Analysis COURIER C119957 Round: 0 Dec. 31, 2020 Accessibility C 119957 Performance Performance Statistics Total Industry Unit Demand Actual Industry Unit Sales Segment of Total Industry Andrews 1,915 11.915 18.4% Biswa Next Year's Segment Growth Rata 116.0% Performance Customer Buying Criteria Expectations Importance Chese Dob E Round: 0 Dec. 31, 2020 11.915 CAPSTONE Performance Segment Analysis COURIER C119957 Performance Statistics Accessibility C119957 Performance Total Industry Unit Demand 1.915 Andrews Actual Industry Unit Sales Segment % of Total Industry 18.4% Baldwin Next Year's Segment Growth Rate 116.9% Chester Performance Customer Buying Criteria Digby Expectations Importance Ene 1. Reliability MTBF 22000-27000 43% 2. Ideal Position Pfmn 9.4 Size 16.0 29% Ferris 3. Price $25.00 - 35.00 19% 4. Age Ideal Age - 1.0 9% Perceptual Map for Performance Actual vs Potential Market Share Perceptual map (at end of this year) 2020 C119957 Performance 20 18 16". 10 14 12. 10 S 12 Sure 10 2 4 6 8 10 12 14 16 18 20 Performance Actu - Fotents 94 Name AN Bold Coat Dot Edge Foam Able Baker Cake Daze Eat Fast Market Share 17% 17% 17% 17% 17% 17% 0% 0% 0% 0% 0% 0% Units Sold to Seg 317 317 317 317 317 317 2 2 2 2 2 2 Revision Date 6/30/2018 6/30/2018 6/30/2018 6/30/2018 6/30/2018 6/30/2018 11/21/2017 11/21/2017 11/21/2017 11/21/2017 11/21/2017 11/21/2017 Top Products in Performance Segment CUSE Stock Pfmn Size List Age Promo Aware- Out Coord Coord Price MTBF Dec 31 Budget 94 15.5 $33.00 25000 250 $700 46% 9.4 15.5 $33.00 25000 2.50 $700 46% 15.5 $33.00 25000 2.50 $700 40% 9.4 15.5 $33.00 25000 2.50 $700 46% 9.4 15 5 $33.00 25000 250 $700 46% 9.4 15.5 $33.00 25000 2 50 $700 46% 5.5 14.5 $28.00 17500 3.10 $1,000 55% 5.5 14,5 $28.00 17500 3.10 $1,000 55% 5.5 14.5 $28.00 17500 3.10 $1,000 56% 5.5 14.5 $28.00 17500 3.10 $1,000 55% 5.5 14.5 $28.00 17500 3.10 $1,000 55% 5.5 14.5 $28.00 17500 3.10 $1,000 55% Cust DEC Sales Access Cust Budgetibility Survey $700 37% 20 $700 37% 20 $700 37% 20 $700 37% 20 $700 37% 20 $700 37% 20 $1.000 37% 0 $1,000 37% 0 $1,000 37% 0 $1,000 37% 0 $1.000 37% 0 $1,000 37% 0 CAPSTONEO COURIER Page 8 CAROTONI Size Segment Analysis COURIER C119957 Round: 0 Dec. 31, 2020 Accessibility C119957 Size Size Statistics Total Industry Unit Demand Actual Industry Unit Sales Segment of Total Industry Ar 1,984 11.984 18.75 115.0 Next Years Segment Growi RM Size Customer Buying Criteria CAPSTONE Size Segment Analysis COURIER C119957 Round: 0 Dec. 31, 2020 Accessibility C119957 Size Size Statistics Total Industry Unit Demand Actual Industry Unit Sales Segment % of Total Industry Andrews 1,984 11.984 18.7% Baldwin Chester Digby Ere Ferris Next Year's Segment Growth Rale 115.9% Size Customer Buying Criteria Expectations Importance 1. Ideal Position Pimn 4.0 Size 10.6 43% 2. Age Ideal Age 1.5 29% 3. Reliability MTBF 10000 21000 19% 4. Price $25.00 - 35.00 9% Perceptual Map for Size Perceptual map (at end of this year) 20 SM Actual vs Potential Market Share 2020 C 119