

Question: After running solver, we got the sensitivity analysis table as following. Table 1 : Sensitivity Analysis for Tropicsun table [ [ C o l
After running solver, we got the sensitivity analysis table as following.
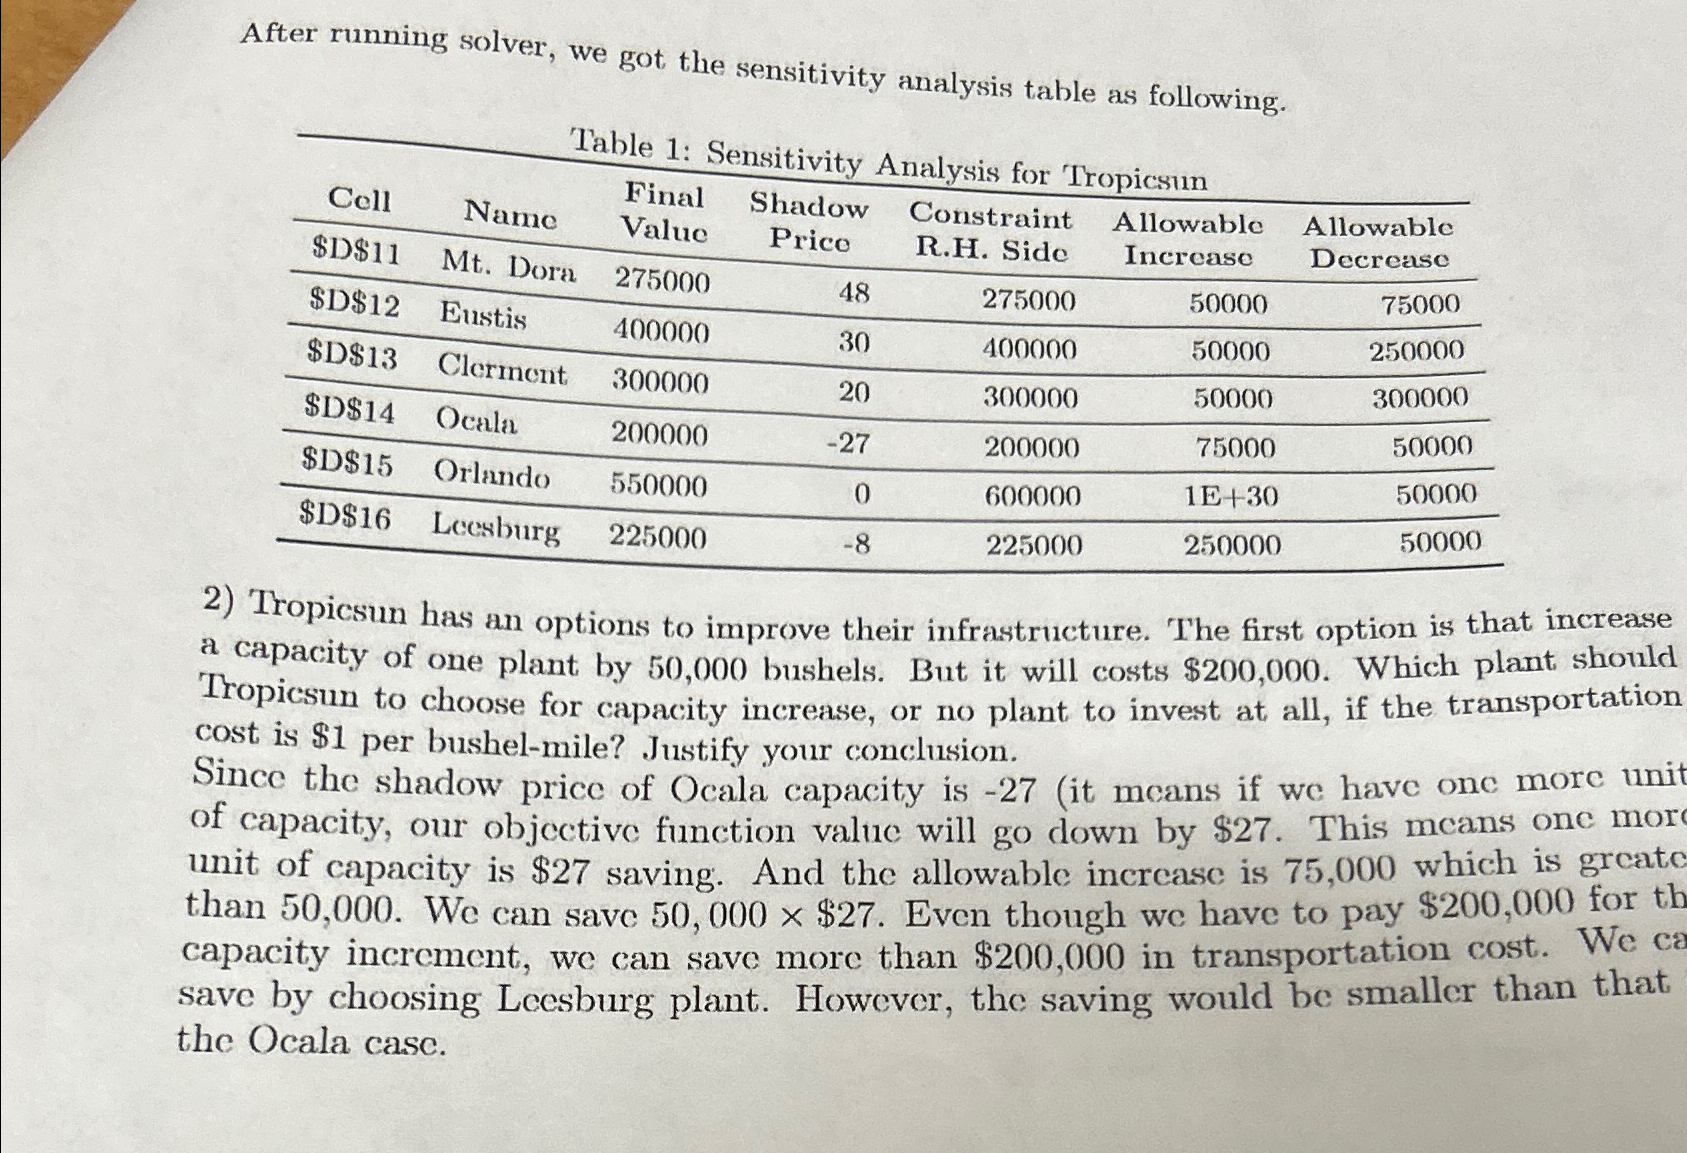
Table : Sensitivity Analysis for Tropicsun
tableName,tableFinalValuetableShadowPricetableConstraintRH SidetableopicsinAllowableIncreasetableAllowableDecreaseMt Dora,Eustis,Clerment,Ocala,$$Orlando,$$Leesburg,
Tropicsun has an options to improve their infrastructure. The first option is that increase a capacity of one plant by bushels. But it will costs $ Which plant should Tropicsun to choose for capacity increase, or no plant to invest at all, if the transportation cost is $ per bushelmile? Justify your conclusion.
Since the shadow price of Ocala capacity is it means if we have one more uni of capacity, our objective function value will go down by $ This means one mor unit of capacity is $ saving. And the allowable increase is which is greate than We can save $ Even though we have to pay $ for th capacity increment, we can save more than $ in transportation cost. We ca save by choosing Leesburg plant. However, the saving would be smaller than that the Ocala case.
Step by Step Solution
There are 3 Steps involved in it
1 Expert Approved Answer
Step: 1 Unlock

Question Has Been Solved by an Expert!
Get step-by-step solutions from verified subject matter experts
Step: 2 Unlock
Step: 3 Unlock