Question: After this conversation, Brodie realized that he had a lot of work to do. He knew from his operations management class that he needed to
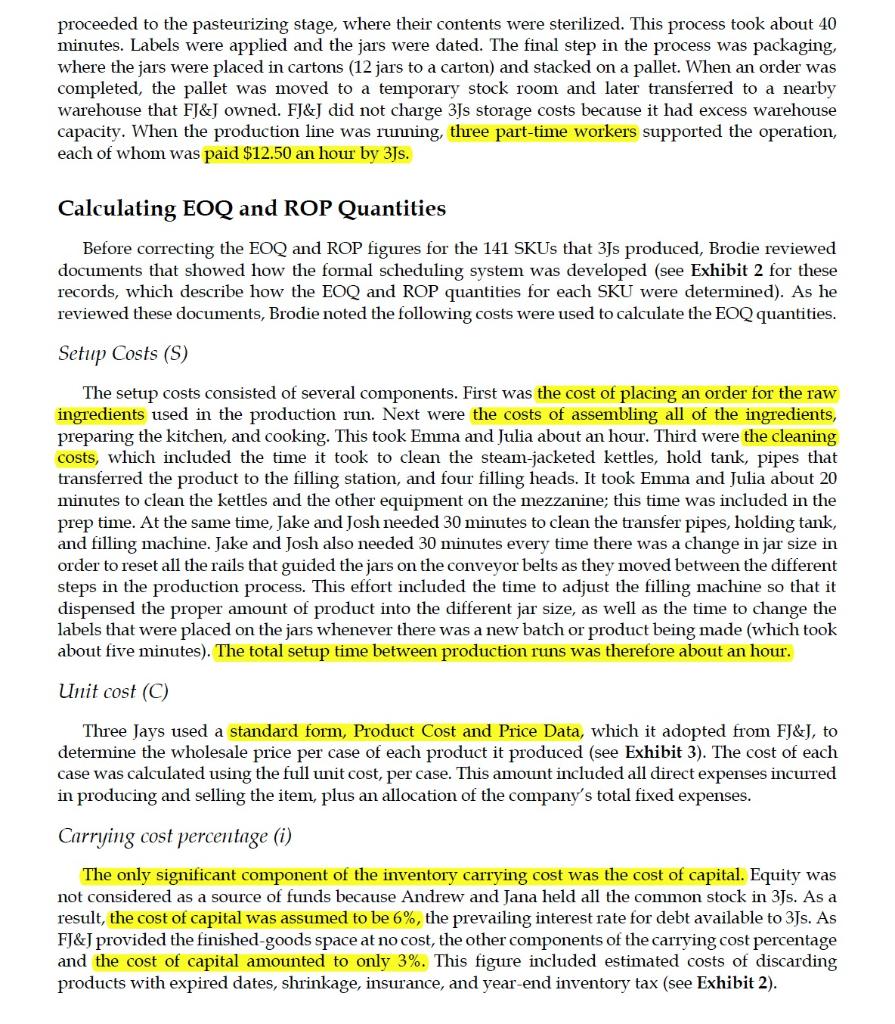
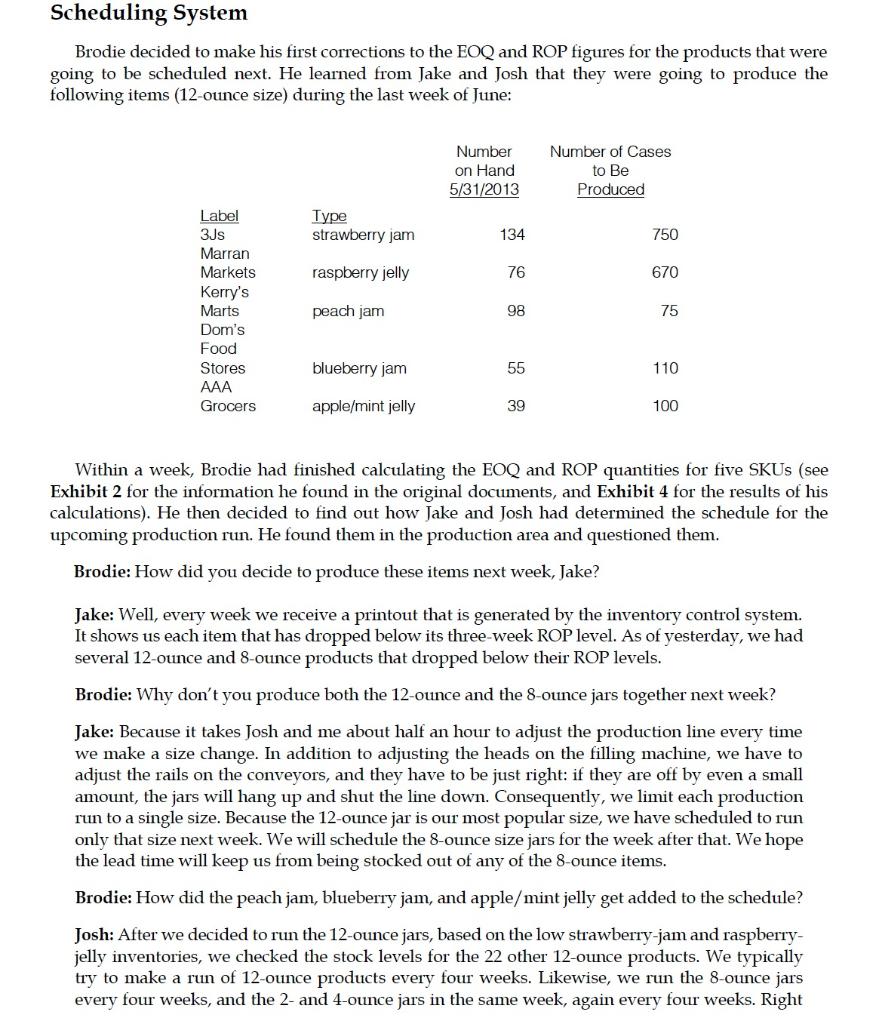
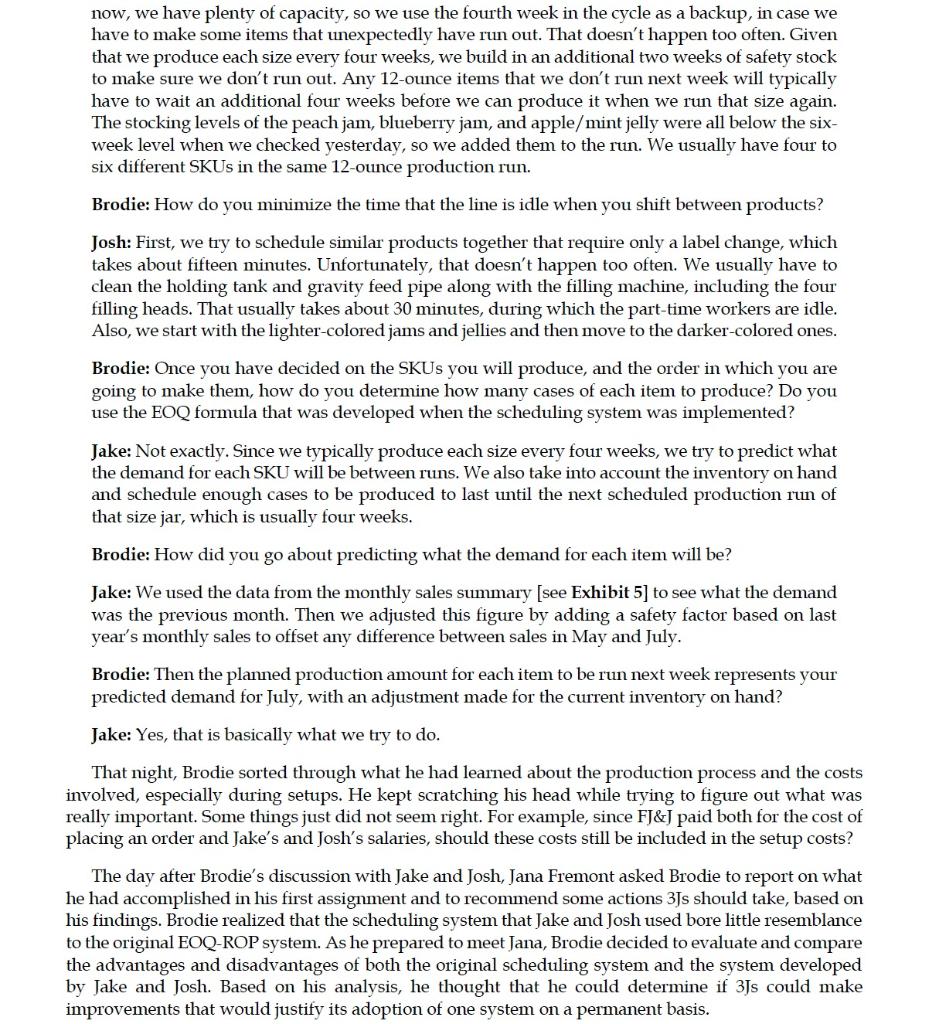
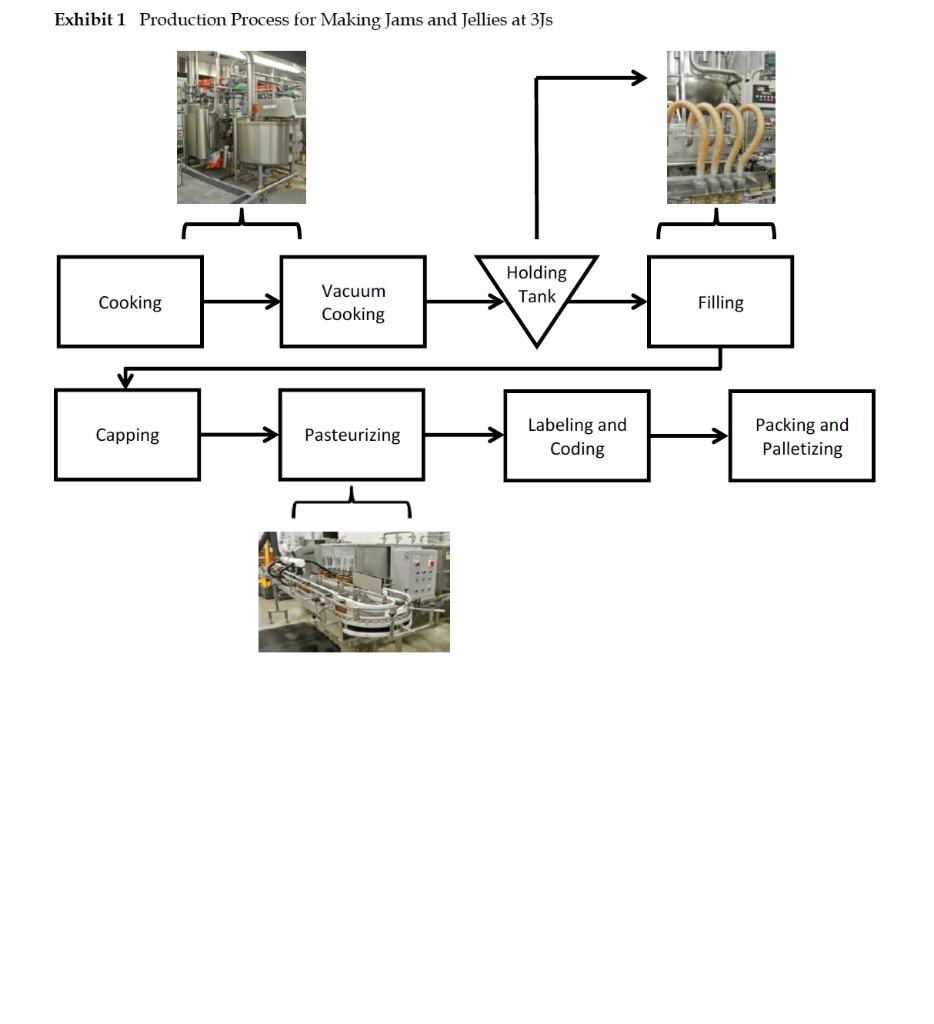
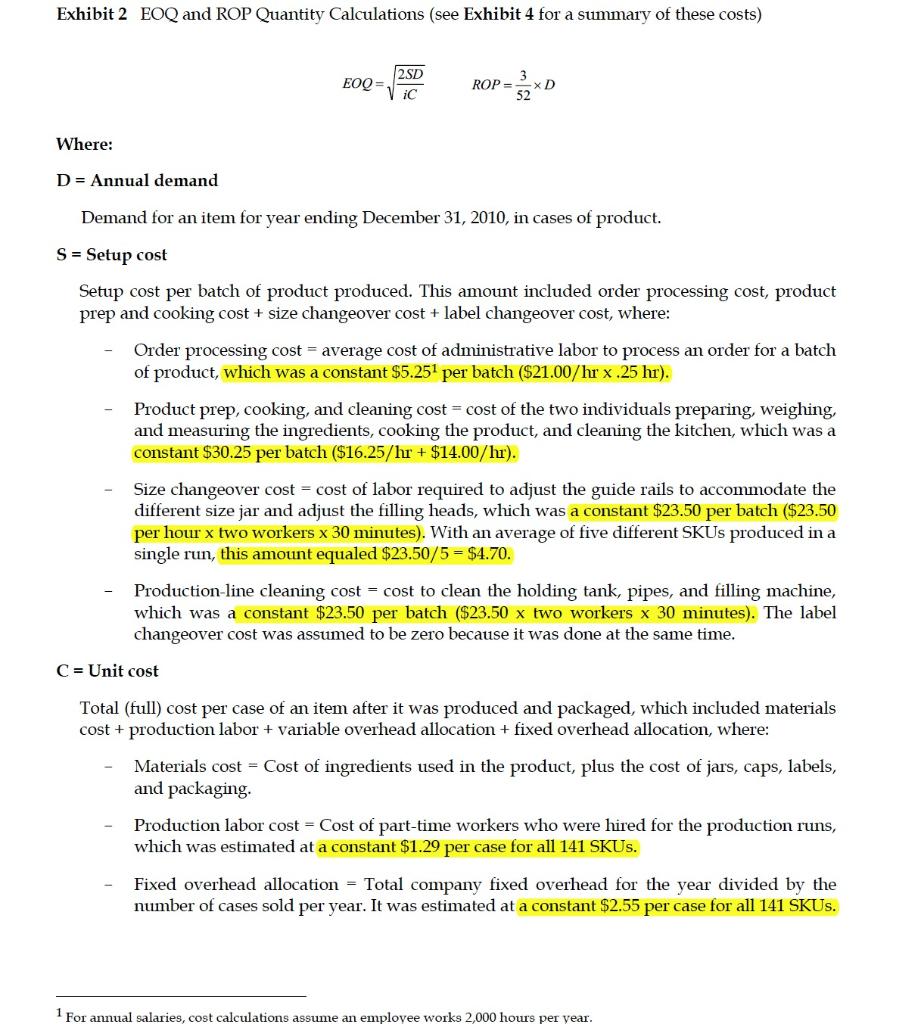
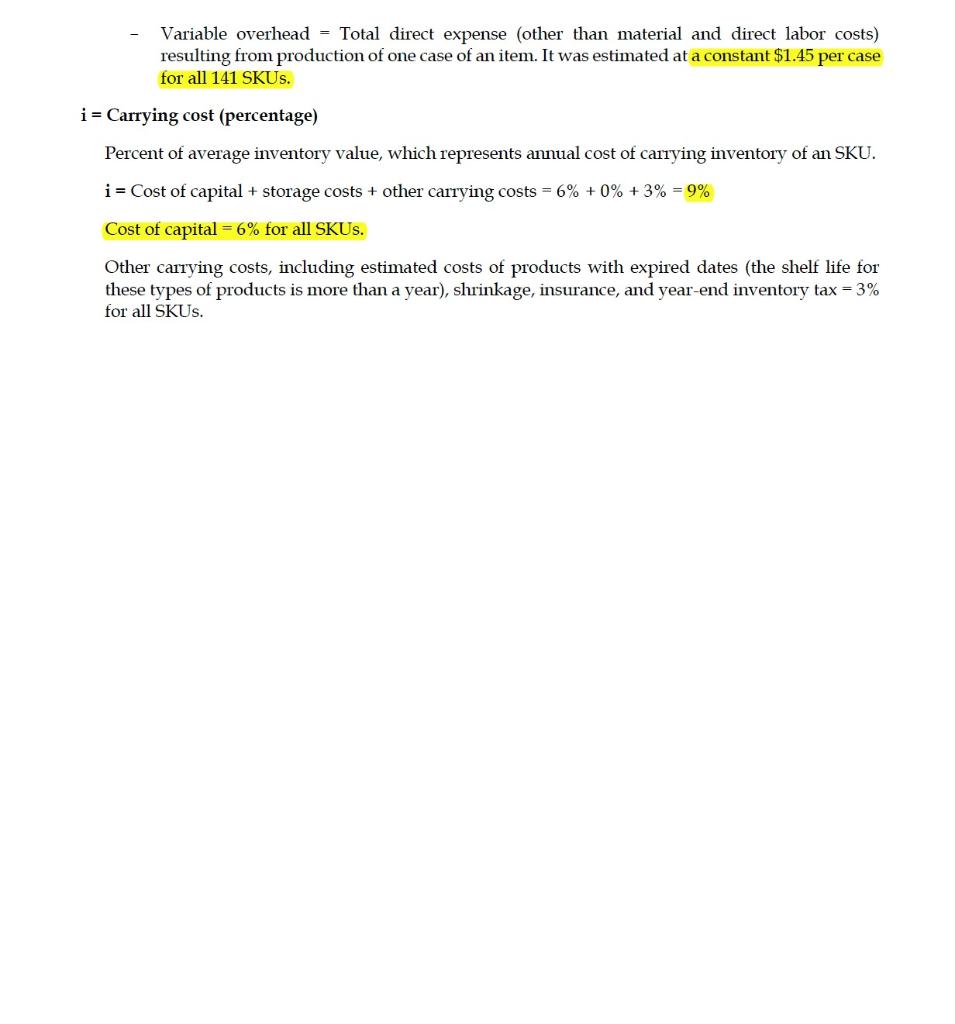
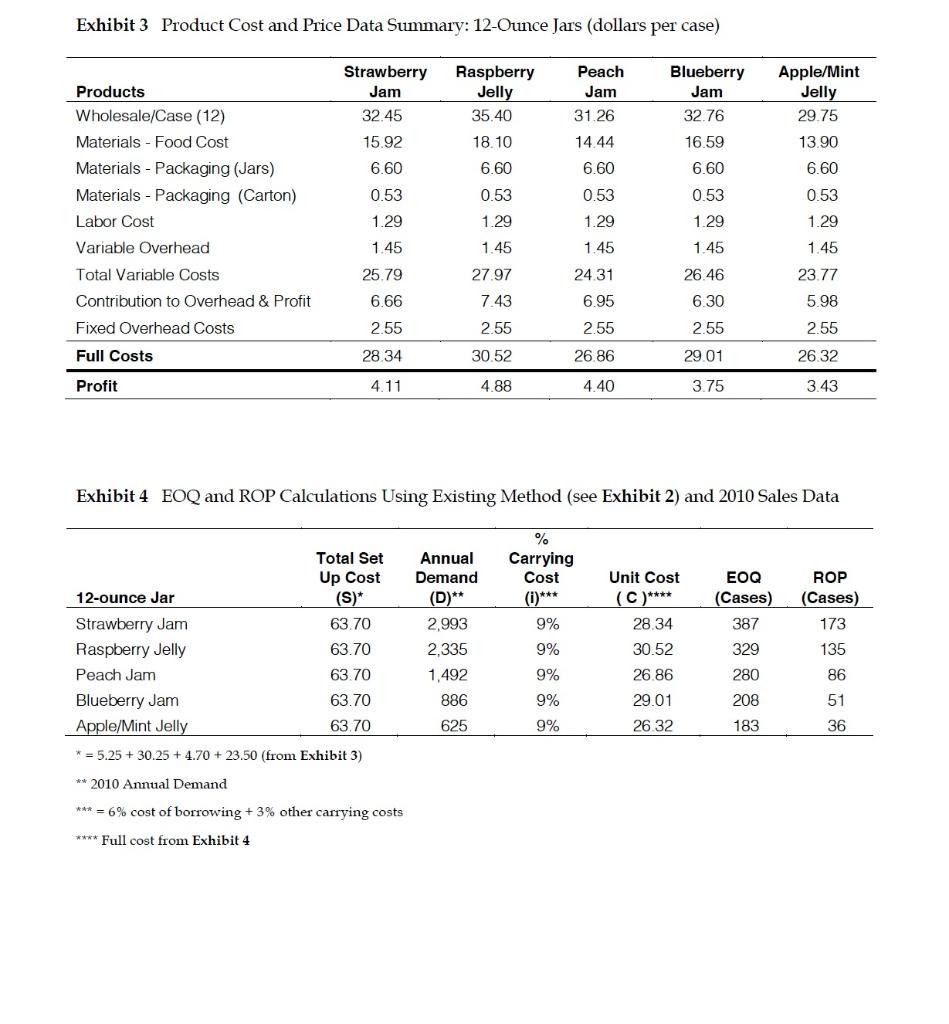
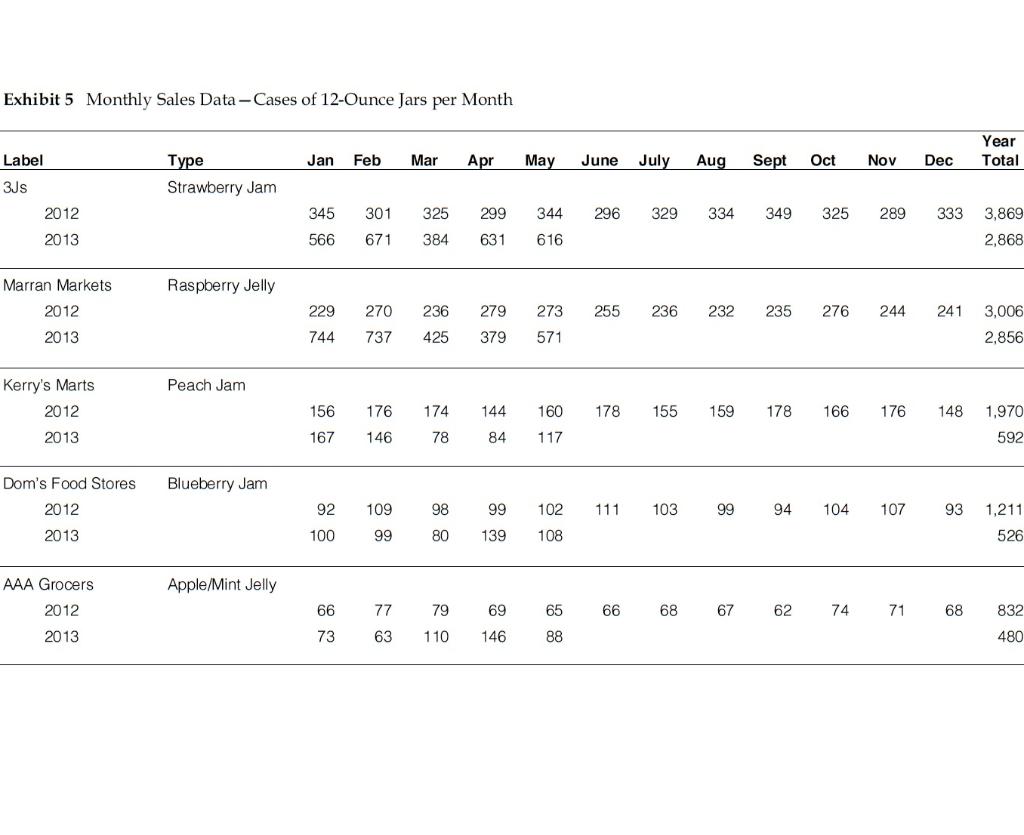
After this conversation, Brodie realized that he had a lot of work to do. He knew from his operations management class that he needed to make sure he was using the right data to analyze the problem. He kept hearing in his head his professor's voice: "Garbage in means garbage out." He therefore wanted to get a good understanding of the production process and the various costs involved. Company Background Three Jays Corporation was started by Jana Fremont. It was a wholly owned subsidiary of Fremont Jams and Jellies (FJ&J). Whereas FJ&J was primarily a contract manufacturer (also known as a "co- packer" in the food industry) that processed fruits into jams and jellies under private labels for large supermarket chains in the United States, 3Js focused on producing organic jams and jellies under its own label and for specialty stores and small food chains that sell primarily organic food products. Located in rural Michigan, FJ&J was founded by Jana's grandfather Alex Fremont in 1954, shortly after he returned home from serving in the U.S. Army during the Korean War. Having grown up in Michigan, Alex saw the potential of starting a business that processed locally grown fruits, such as blueberries, strawberries, peaches, and cherries into high-quality jams and jellies. Initially, he produced jams and jellies only under the firm's own label, Fremont Preserves. In 1971, however, a major supermarket chain in the Midwest approached him about producing jams and jellies under its own private label. Given that FJ&J had surplus capacity at that time, he entered into a contract with the supermarket chain. Over time, FJ&J became known for high-quality products. It was subsequently approached by other supermarket chains to produce jams and jellies under their own private labels. Andrew Fremont, Alex's son, joined the company in 1980 after he graduated from business school, where he had majored in operations management. In applying his education, Andrew focused on increasing the overall efficiency of FJ&J's manufacturing processes. He then became president of FJ&J, in 1992, as Alex began to take a less active role in FJ&J's daily operations. With Andrew at the helm, FJ&J focused more on private-label products. By 2000, FJ&J was producing only private-label products. Jana Fremont, Alex's daughter, joined FJ&J in 2005 following her graduation from college and two years in the Peace Corps. Jana saw a growing market for organic food products, and convinced her father to let her start a new business that would make only organic jams and jellies. In order to comply with the accepted practices and regulations required for products to be labeled organic, Andrew and Jana agreed that the new manufacturing facility should be totally separate from FJ&J's main production operations. As there was some unused floor space at one end of the production area and surplus equipment available, Jana set up as a totally independent operation with its own storage areas for raw materials and finished goods, as well as its own production equipment. Producing Jams and Jellies at 3Js Product line During his first week, Brodie learned that 3Js' product line comprised six types of jams and jellies that were packaged in four different size jars - 2,4,8, and 12 ounces - under its own label. 3Js also sold its products to several small chains and independent supermarkets under their own private labels. In all, 3Js had 141 SKUs, broken down as follows: proceeded to the pasteurizing stage, where their contents were sterilized. This process took about 40 minutes. Labels were applied and the jars were dated. The final step in the process was packaging, where the jars were placed in cartons (12 jars to a carton) and stacked on a pallet. When an order was completed, the pallet was moved to a temporary stock room and later transferred to a nearby warehouse that FJ&J owned. FJ&J did not charge 3Js storage costs because it had excess warehouse capacity. When the production line was running, three part-time workers supported the operation, each of whom was paid $12.50 an hour by 3Js. Calculating EOQ and ROP Quantities Before correcting the EOQ and ROP figures for the 141 SKUs that 3Js produced, Brodie reviewed documents that showed how the formal scheduling system was developed (see Exhibit 2 for these records, which describe how the EOQ and ROP quantities for each SKU were determined). As he reviewed these documents, Brodie noted the following costs were used to calculate the EOQ quantities. Setup Costs (S) The setup costs consisted of several components. First was the cost of placing an order for the raw ingredients used in the production run. Next were the costs of assembling all of the ingredients, preparing the kitchen, and cooking. This took Emma and Julia about an hour. Third were the cleaning costs, which included the time it took to clean the steam-jacketed kettles, hold tank, pipes that transferred the product to the filling station, and four filling heads. It took Emma and Julia about 20 minutes to clean the kettles and the other equipment on the mezzanine; this time was included in the prep time. At the same time, Jake and Josh needed 30 minutes to clean the transfer pipes, holding tank, and filling machine. Jake and Josh also needed 30 minutes every time there was a change in jar size in order to reset all the rails that guided the jars on the conveyor belts as they moved between the different steps in the production process. This effort included the time to adjust the filling machine so that it dispensed the proper amount of product into the different jar size, as well as the time to change the labels that were placed on the jars whenever there was a new batch or product being made (which took about five minutes). The total setup time between production runs was therefore about an hour. Unit cost (C) Three Jays used a standard form, Product Cost and Price Data, which it adopted from FJ&J, to determine the wholesale price per case of each product it produced (see Exhibit 3). The cost of each case was calculated using the full unit cost, per case. This amount included all direct expenses incured in producing and selling the item, plus an allocation of the company's total fixed expenses. Carrying cost percentage (i) The only significant component the inventory carrying cost was the cost of capital. Equity was not considered as a source of funds because Andrew and Jana held all the common stock in 3Js. As a result, the cost of capital was assumed to be 6%, the prevailing interest rate for debt available to 3Js. As FJ&J provided the finished-goods space at no cost, the other components of the carrying cost percentage and the cost of capital amounted to only 3%. This figure included estimated costs of discarding products with expired dates, shrinkage, insurance, and year-end inventory tax (see Exhibit 2). Scheduling System Brodie decided to make his first corrections to the EOQ and ROP figures for the products that were going to be scheduled next. He learned from Jake and Josh that they were going to produce the following items (12-ounce size) during the last week of June: Number on Hand 5/31/2013 Number of Cases to Be Produced Type strawberry jam 134 750 raspberry jelly 76 670 Label 3JS Marran Markets Kerry's Marts Dom's Food Stores AAA Grocers peach jam 98 75 blueberry jam 55 110 apple/mint jelly 39 100 Within a week, Brodie had finished calculating the EOQ and ROP quantities for five SKUs (see Exhibit 2 for the information he found in the original documents, and Exhibit 4 for the results of his calculations). He then decided to find out how Jake and Josh had determined the schedule for the upcoming production run. He found them in the production area and questioned them. Brodie: How did you decide to produce these items next week, Jake? Jake: Well, every week we receive a printout that is generated by the inventory control system. It shows us each item that has dropped below its three-week ROP level. As of yesterday, we had several 12-ounce and 8-ounce products that dropped below their ROP levels. Brodie: Why don't you produce both the 12-ounce and the 8-ounce jars together next week? Jake: Because it takes Josh and me about half an hour to adjust the production line every time we make a size change. In addition to adjusting the heads on the filling machine, we have to adjust the rails on the conveyors, and they have to be just right: if they are off by even a small amount, the jars will hang up and shut the line down. Consequently, we limit each production run to a single size. Because the 12-ounce jar is our most popular size, we have scheduled to run only that size next week. We will schedule the 8-ounce size jars for the week after that. We hope the lead time will keep us from being stocked out of any of the 8-ounce items. Brodie: How did the peach jam, blueberry jam, and apple/mint jelly get added to the schedule? Josh: After we decided to run the 12-ounce jars, based on the low strawberry-jam and raspberry- jelly inventories, we checked the stock levels for the 22 other 12-ounce products. We typically try to make a run of 12-ounce products every four weeks. Likewise, we run the 8-ounce jars every four weeks, and the 2- and 4-ounce jars in the same week, again every four weeks. Right now, we have plenty of capacity, so we use the fourth week in the cycle as a backup, in case we have to make some items that unexpectedly have run out. That doesn't happen too often. Given that we produce each size every four weeks, we build in an additional two weeks of safety stock to make sure we don't run out. Any 12-ounce items that we don't run next week will typically have to wait an additional four weeks before we can produce it when we run that size again. The stocking levels of the peach jam, blueberry jam, and apple/mint jelly were all below the six- week level when we checked yesterday, so we added them to the run. We usually have four to six different SKUs in the same 12-ounce production run. Brodie: How do you minimize the time that the line is idle when you shift between products? Josh: First, we try to schedule similar products together that require only a label change, which takes about fifteen minutes. Unfortunately, that doesn't happen too often. We usually have to clean the holding tank and gravity feed pipe along with the filling machine, including the four filling heads. That usually takes about 30 minutes, during which the part-time workers are idle. Also, we start with the lighter-colored jams and jellies and then move to the darker-colored ones. Brodie: Once you have decided on the SKUs you will produce, and the order in which you are going to make them, how do you determine how many cases of each item to produce? Do you use the EOQ formula that was developed when the scheduling system was implemented? Jake: Not exactly. Since we typically produce each size every four weeks, we try to predict what the demand for each SKU will be between runs. We also take into account the inventory on hand and schedule enough cases to be produced to last until the next scheduled production run of that size jar, which is usually four weeks. Brodie: How did you go about predicting what the demand for each item will be? Jake: We used the data from the monthly sales summary (see Exhibit 5] to see what the demand was the previous month. Then we adjusted this figure by adding a safety factor based on last year's monthly sales to offset any difference between sales in May and July. Brodie: Then the planned production amount for each item to be run next week represents your predicted demand for July, with an adjustment made for the current inventory on hand? Jake: Yes, that is basically what we try to do. That night, Brodie sorted through what he had learned about the production process and the costs involved, especially during setups. He kept scratching his head while trying to figure out what was really important. Some things just did not seem right. For example, since FJ&J paid both for the cost of placing an order and Jake's and Josh's salaries, should these costs still be included in the setup costs? The day after Brodie's discussion with Jake and Josh, Jana Fremont asked Brodie to report on what he had accomplished in his first assignment and to recommend some actions 3Js should take, based on his findings. Brodie realized that the scheduling system that Jake and Josh used bore little resemblance to the original EOQ-ROP system. As he prepared to meet Jana, Brodie decided to evaluate and compare the advantages and disadvantages of both the original scheduling system and the system developed by Jake and Josh. Based on his analysis, he thought that he could determine if 3Js could make improvements that would justify its adoption of one system on a permanent basis. Exhibit 1 Production Process for Making Jams and Jellies at 3Js Holding Tank Vacuum Cooking Filling Cooking Packing and Capping Pasteurizing Labeling and Coding Palletizing Exhibit 2 EOQ and ROP Quantity Calculations (see Exhibit 4 for a summary of these costs) 2SD EOQ= iC ROP XD Where: D = Annual demand Demand for an item for year ending December 31, 2010, in cases of product. S = Setup cost Setup cost per batch of product produced. This amount included order processing cost, product prep and cooking cost + size changeover cost + label changeover cost, where: Order processing cost = average cost of administrative labor to process an order for a batch of product, which was a constant $5.251 per batch ($21.00/hr x.25 hr). Product prep, cooking, and cleaning cost = cost of the two individuals preparing, weighing, and measuring the ingredients, cooking the product, and cleaning the kitchen, which was a constant $30.25 per batch ($16.25/hr + $14.00/hr). Size changeover cost = cost of labor required to adjust the guide rails to accommodate the different size jar and adjust the filling heads, which was a constant $23.50 per batch ($23.50 per hour x two workers x 30 minutes). With an average of five different SKUs produced in a single run, this amount equaled $23.50/5 = $4.70. Production-line cleaning cost = cost to clean the holding tank, pipes, and filling machine, which was a constant $23.50 per batch ($23.50 x two workers x 30 minutes). The label changeover cost was assumed to be zero because it was done at the same time. C = Unit cost Total (full) cost per case of an item after it was produced and packaged, which included materials cost + production labor + variable overhead allocation + fixed overhead allocation, where: Materials cost = Cost of ingredients used in the product, plus the cost of jars, caps, labels, and packaging. Production labor cost = Cost of part-time workers who were hired for the production runs, which was estimated at a constant $1.29 per case for all 141 SKUs. Fixed overhead allocation = Total company fixed overhead for the year divided by the number of cases sold per year. It was estimated at a constant $2.55 per case for all 141 SKUs. 1 For annual salaries, cost calculations assume an employee works 2,000 hours per year. Variable overhead = Total direct expense (other than material and direct labor costs) resulting from production of one case of an item. It was estimated at a constant $1.45 per case for all 141 SKUs. i = Carrying cost (percentage) Percent of average inventory value, which represents annual cost of carrying inventory of an SKU. i = Cost of capital + storage costs + other carrying costs = 6% +0% +3% = 9% Cost of capital =6% for all SKUs. Other carrying costs, including estimated costs of products with expired dates (the shelf life for these types of products is more than a year), shrinkage, insurance, and year-end inventory tax = 3% for all SKUs. Exhibit 3 Product Cost and Price Data Summary: 12-Ounce Jars (dollars per case) Peach Strawberry Jam Raspberry Jelly Blueberry Jam Products Jam Apple/Mint Jelly 29.75 Wholesale/Case (12) 32.45 35.40 31.26 32.76 Materials - Food Cost 15.92 18.10 14.44 16.59 13.90 6.60 6.60 6.60 6.60 6.60 Materials - Packaging (Jars) Materials - Packaging (Carton) 0.53 0.53 0.53 0.53 0.53 Labor Cost 1.29 1.29 1.29 1.29 1.29 Variable Overhead 1.45 1.45 1.45 1.45 1.45 Total Variable Costs 25.79 27.97 24.31 26.46 23.77 Contribution to Overhead & Profit 6.66 7.43 6.95 6.30 5.98 Fixed Overhead Costs 2.55 2.55 2.55 2.55 2.55 Full Costs 28.34 30.52 26.86 29.01 26.32 Profit 4.11 4.88 4.40 3.75 3.43 Exhibit 4 EOQ and ROP Calculations Using Existing Method (see Exhibit 2) and 2010 Sales Data Total Set Up Cost (S)* Annual Demand (D)** % Carrying Cost (i) *** Unit Cost (C)**** EOQ (Cases) ROP (Cases) 12-ounce Jar 63.70 2,993 9% 28.34 387 173 Strawberry Jam Raspberry Jelly 63.70 2,335 9% 30.52 329 135 Peach Jam 63.70 1,492 9% 26.86 280 86 63.70 886 9% 29.01 208 51 Blueberry Jam Apple/Mint Jelly 63.70 625 9% 26.32 183 36 * = 5.25 + 30.25 +4.70 + 23.50 (from Exhibit 3) ** 2010 Annual Demand *** = 6% cost of borrowing +3% other carrying costs **** Full cost from Exhibit 4 Exhibit 5 Monthly Sales Data-Cases of 12-Ounce Jars per Month Year Total Label Jan Feb Mar Apr May June July Aug Sept Oct Nov Dec Type Strawberry Jam 3JS 2012 345 301 325 299 344 296 329 334 349 325 289 333 3,869 2013 566 671 384 631 616 2,868 Marran Markets Raspberry Jelly 2012 229 270 236 279 273 255 236 232 235 276 244 241 3,006 2013 744 737 425 379 571 2,856 Kerry's Marts Peach Jam 2012 156 176 174 144 160 178 155 159 178 166 176 148 1,970 2013 167 146 78 84 117 592 Dom's Food Stores Blueberry Jam 2012 92 109 98 99 102 111 103 99 94 104 107 93 1,211 2013 100 99 80 139 108 526 AAA Grocers Apple/Mint Jelly 2012 66 77 79 69 65 66 68 67 62 74 71 68 832 2013 73 63 110 146 88 480 After this conversation, Brodie realized that he had a lot of work to do. He knew from his operations management class that he needed to make sure he was using the right data to analyze the problem. He kept hearing in his head his professor's voice: "Garbage in means garbage out." He therefore wanted to get a good understanding of the production process and the various costs involved. Company Background Three Jays Corporation was started by Jana Fremont. It was a wholly owned subsidiary of Fremont Jams and Jellies (FJ&J). Whereas FJ&J was primarily a contract manufacturer (also known as a "co- packer" in the food industry) that processed fruits into jams and jellies under private labels for large supermarket chains in the United States, 3Js focused on producing organic jams and jellies under its own label and for specialty stores and small food chains that sell primarily organic food products. Located in rural Michigan, FJ&J was founded by Jana's grandfather Alex Fremont in 1954, shortly after he returned home from serving in the U.S. Army during the Korean War. Having grown up in Michigan, Alex saw the potential of starting a business that processed locally grown fruits, such as blueberries, strawberries, peaches, and cherries into high-quality jams and jellies. Initially, he produced jams and jellies only under the firm's own label, Fremont Preserves. In 1971, however, a major supermarket chain in the Midwest approached him about producing jams and jellies under its own private label. Given that FJ&J had surplus capacity at that time, he entered into a contract with the supermarket chain. Over time, FJ&J became known for high-quality products. It was subsequently approached by other supermarket chains to produce jams and jellies under their own private labels. Andrew Fremont, Alex's son, joined the company in 1980 after he graduated from business school, where he had majored in operations management. In applying his education, Andrew focused on increasing the overall efficiency of FJ&J's manufacturing processes. He then became president of FJ&J, in 1992, as Alex began to take a less active role in FJ&J's daily operations. With Andrew at the helm, FJ&J focused more on private-label products. By 2000, FJ&J was producing only private-label products. Jana Fremont, Alex's daughter, joined FJ&J in 2005 following her graduation from college and two years in the Peace Corps. Jana saw a growing market for organic food products, and convinced her father to let her start a new business that would make only organic jams and jellies. In order to comply with the accepted practices and regulations required for products to be labeled organic, Andrew and Jana agreed that the new manufacturing facility should be totally separate from FJ&J's main production operations. As there was some unused floor space at one end of the production area and surplus equipment available, Jana set up as a totally independent operation with its own storage areas for raw materials and finished goods, as well as its own production equipment. Producing Jams and Jellies at 3Js Product line During his first week, Brodie learned that 3Js' product line comprised six types of jams and jellies that were packaged in four different size jars - 2,4,8, and 12 ounces - under its own label. 3Js also sold its products to several small chains and independent supermarkets under their own private labels. In all, 3Js had 141 SKUs, broken down as follows: proceeded to the pasteurizing stage, where their contents were sterilized. This process took about 40 minutes. Labels were applied and the jars were dated. The final step in the process was packaging, where the jars were placed in cartons (12 jars to a carton) and stacked on a pallet. When an order was completed, the pallet was moved to a temporary stock room and later transferred to a nearby warehouse that FJ&J owned. FJ&J did not charge 3Js storage costs because it had excess warehouse capacity. When the production line was running, three part-time workers supported the operation, each of whom was paid $12.50 an hour by 3Js. Calculating EOQ and ROP Quantities Before correcting the EOQ and ROP figures for the 141 SKUs that 3Js produced, Brodie reviewed documents that showed how the formal scheduling system was developed (see Exhibit 2 for these records, which describe how the EOQ and ROP quantities for each SKU were determined). As he reviewed these documents, Brodie noted the following costs were used to calculate the EOQ quantities. Setup Costs (S) The setup costs consisted of several components. First was the cost of placing an order for the raw ingredients used in the production run. Next were the costs of assembling all of the ingredients, preparing the kitchen, and cooking. This took Emma and Julia about an hour. Third were the cleaning costs, which included the time it took to clean the steam-jacketed kettles, hold tank, pipes that transferred the product to the filling station, and four filling heads. It took Emma and Julia about 20 minutes to clean the kettles and the other equipment on the mezzanine; this time was included in the prep time. At the same time, Jake and Josh needed 30 minutes to clean the transfer pipes, holding tank, and filling machine. Jake and Josh also needed 30 minutes every time there was a change in jar size in order to reset all the rails that guided the jars on the conveyor belts as they moved between the different steps in the production process. This effort included the time to adjust the filling machine so that it dispensed the proper amount of product into the different jar size, as well as the time to change the labels that were placed on the jars whenever there was a new batch or product being made (which took about five minutes). The total setup time between production runs was therefore about an hour. Unit cost (C) Three Jays used a standard form, Product Cost and Price Data, which it adopted from FJ&J, to determine the wholesale price per case of each product it produced (see Exhibit 3). The cost of each case was calculated using the full unit cost, per case. This amount included all direct expenses incured in producing and selling the item, plus an allocation of the company's total fixed expenses. Carrying cost percentage (i) The only significant component the inventory carrying cost was the cost of capital. Equity was not considered as a source of funds because Andrew and Jana held all the common stock in 3Js. As a result, the cost of capital was assumed to be 6%, the prevailing interest rate for debt available to 3Js. As FJ&J provided the finished-goods space at no cost, the other components of the carrying cost percentage and the cost of capital amounted to only 3%. This figure included estimated costs of discarding products with expired dates, shrinkage, insurance, and year-end inventory tax (see Exhibit 2). Scheduling System Brodie decided to make his first corrections to the EOQ and ROP figures for the products that were going to be scheduled next. He learned from Jake and Josh that they were going to produce the following items (12-ounce size) during the last week of June: Number on Hand 5/31/2013 Number of Cases to Be Produced Type strawberry jam 134 750 raspberry jelly 76 670 Label 3JS Marran Markets Kerry's Marts Dom's Food Stores AAA Grocers peach jam 98 75 blueberry jam 55 110 apple/mint jelly 39 100 Within a week, Brodie had finished calculating the EOQ and ROP quantities for five SKUs (see Exhibit 2 for the information he found in the original documents, and Exhibit 4 for the results of his calculations). He then decided to find out how Jake and Josh had determined the schedule for the upcoming production run. He found them in the production area and questioned them. Brodie: How did you decide to produce these items next week, Jake? Jake: Well, every week we receive a printout that is generated by the inventory control system. It shows us each item that has dropped below its three-week ROP level. As of yesterday, we had several 12-ounce and 8-ounce products that dropped below their ROP levels. Brodie: Why don't you produce both the 12-ounce and the 8-ounce jars together next week? Jake: Because it takes Josh and me about half an hour to adjust the production line every time we make a size change. In addition to adjusting the heads on the filling machine, we have to adjust the rails on the conveyors, and they have to be just right: if they are off by even a small amount, the jars will hang up and shut the line down. Consequently, we limit each production run to a single size. Because the 12-ounce jar is our most popular size, we have scheduled to run only that size next week. We will schedule the 8-ounce size jars for the week after that. We hope the lead time will keep us from being stocked out of any of the 8-ounce items. Brodie: How did the peach jam, blueberry jam, and apple/mint jelly get added to the schedule? Josh: After we decided to run the 12-ounce jars, based on the low strawberry-jam and raspberry- jelly inventories, we checked the stock levels for the 22 other 12-ounce products. We typically try to make a run of 12-ounce products every four weeks. Likewise, we run the 8-ounce jars every four weeks, and the 2- and 4-ounce jars in the same week, again every four weeks. Right now, we have plenty of capacity, so we use the fourth week in the cycle as a backup, in case we have to make some items that unexpectedly have run out. That doesn't happen too often. Given that we produce each size every four weeks, we build in an additional two weeks of safety stock to make sure we don't run out. Any 12-ounce items that we don't run next week will typically have to wait an additional four weeks before we can produce it when we run that size again. The stocking levels of the peach jam, blueberry jam, and apple/mint jelly were all below the six- week level when we checked yesterday, so we added them to the run. We usually have four to six different SKUs in the same 12-ounce production run. Brodie: How do you minimize the time that the line is idle when you shift between products? Josh: First, we try to schedule similar products together that require only a label change, which takes about fifteen minutes. Unfortunately, that doesn't happen too often. We usually have to clean the holding tank and gravity feed pipe along with the filling machine, including the four filling heads. That usually takes about 30 minutes, during which the part-time workers are idle. Also, we start with the lighter-colored jams and jellies and then move to the darker-colored ones. Brodie: Once you have decided on the SKUs you will produce, and the order in which you are going to make them, how do you determine how many cases of each item to produce? Do you use the EOQ formula that was developed when the scheduling system was implemented? Jake: Not exactly. Since we typically produce each size every four weeks, we try to predict what the demand for each SKU will be between runs. We also take into account the inventory on hand and schedule enough cases to be produced to last until the next scheduled production run of that size jar, which is usually four weeks. Brodie: How did you go about predicting what the demand for each item will be? Jake: We used the data from the monthly sales summary (see Exhibit 5] to see what the demand was the previous month. Then we adjusted this figure by adding a safety factor based on last year's monthly sales to offset any difference between sales in May and July. Brodie: Then the planned production amount for each item to be run next week represents your predicted demand for July, with an adjustment made for the current inventory on hand? Jake: Yes, that is basically what we try to do. That night, Brodie sorted through what he had learned about the production process and the costs involved, especially during setups. He kept scratching his head while trying to figure out what was really important. Some things just did not seem right. For example, since FJ&J paid both for the cost of placing an order and Jake's and Josh's salaries, should these costs still be included in the setup costs? The day after Brodie's discussion with Jake and Josh, Jana Fremont asked Brodie to report on what he had accomplished in his first assignment and to recommend some actions 3Js should take, based on his findings. Brodie realized that the scheduling system that Jake and Josh used bore little resemblance to the original EOQ-ROP system. As he prepared to meet Jana, Brodie decided to evaluate and compare the advantages and disadvantages of both the original scheduling system and the system developed by Jake and Josh. Based on his analysis, he thought that he could determine if 3Js could make improvements that would justify its adoption of one system on a permanent basis. Exhibit 1 Production Process for Making Jams and Jellies at 3Js Holding Tank Vacuum Cooking Filling Cooking Packing and Capping Pasteurizing Labeling and Coding Palletizing Exhibit 2 EOQ and ROP Quantity Calculations (see Exhibit 4 for a summary of these costs) 2SD EOQ= iC ROP XD Where: D = Annual demand Demand for an item for year ending December 31, 2010, in cases of product. S = Setup cost Setup cost per batch of product produced. This amount included order processing cost, product prep and cooking cost + size changeover cost + label changeover cost, where: Order processing cost = average cost of administrative labor to process an order for a batch of product, which was a constant $5.251 per batch ($21.00/hr x.25 hr). Product prep, cooking, and cleaning cost = cost of the two individuals preparing, weighing, and measuring the ingredients, cooking the product, and cleaning the kitchen, which was a constant $30.25 per batch ($16.25/hr + $14.00/hr). Size changeover cost = cost of labor required to adjust the guide rails to accommodate the different size jar and adjust the filling heads, which was a constant $23.50 per batch ($23.50 per hour x two workers x 30 minutes). With an average of five different SKUs produced in a single run, this amount equaled $23.50/5 = $4.70. Production-line cleaning cost = cost to clean the holding tank, pipes, and filling machine, which was a constant $23.50 per batch ($23.50 x two workers x 30 minutes). The label changeover cost was assumed to be zero because it was done at the same time. C = Unit cost Total (full) cost per case of an item after it was produced and packaged, which included materials cost + production labor + variable overhead allocation + fixed overhead allocation, where: Materials cost = Cost of ingredients used in the product, plus the cost of jars, caps, labels, and packaging. Production labor cost = Cost of part-time workers who were hired for the production runs, which was estimated at a constant $1.29 per case for all 141 SKUs. Fixed overhead allocation = Total company fixed overhead for the year divided by the number of cases sold per year. It was estimated at a constant $2.55 per case for all 141 SKUs. 1 For annual salaries, cost calculations assume an employee works 2,000 hours per year. Variable overhead = Total direct expense (other than material and direct labor costs) resulting from production of one case of an item. It was estimated at a constant $1.45 per case for all 141 SKUs. i = Carrying cost (percentage) Percent of average inventory value, which represents annual cost of carrying inventory of an SKU. i = Cost of capital + storage costs + other carrying costs = 6% +0% +3% = 9% Cost of capital =6% for all SKUs. Other carrying costs, including estimated costs of products with expired dates (the shelf life for these types of products is more than a year), shrinkage, insurance, and year-end inventory tax = 3% for all SKUs. Exhibit 3 Product Cost and Price Data Summary: 12-Ounce Jars (dollars per case) Peach Strawberry Jam Raspberry Jelly Blueberry Jam Products Jam Apple/Mint Jelly 29.75 Wholesale/Case (12) 32.45 35.40 31.26 32.76 Materials - Food Cost 15.92 18.10 14.44 16.59 13.90 6.60 6.60 6.60 6.60 6.60 Materials - Packaging (Jars) Materials - Packaging (Carton) 0.53 0.53 0.53 0.53 0.53 Labor Cost 1.29 1.29 1.29 1.29 1.29 Variable Overhead 1.45 1.45 1.45 1.45 1.45 Total Variable Costs 25.79 27.97 24.31 26.46 23.77 Contribution to Overhead & Profit 6.66 7.43 6.95 6.30 5.98 Fixed Overhead Costs 2.55 2.55 2.55 2.55 2.55 Full Costs 28.34 30.52 26.86 29.01 26.32 Profit 4.11 4.88 4.40 3.75 3.43 Exhibit 4 EOQ and ROP Calculations Using Existing Method (see Exhibit 2) and 2010 Sales Data Total Set Up Cost (S)* Annual Demand (D)** % Carrying Cost (i) *** Unit Cost (C)**** EOQ (Cases) ROP (Cases) 12-ounce Jar 63.70 2,993 9% 28.34 387 173 Strawberry Jam Raspberry Jelly 63.70 2,335 9% 30.52 329 135 Peach Jam 63.70 1,492 9% 26.86 280 86 63.70 886 9% 29.01 208 51 Blueberry Jam Apple/Mint Jelly 63.70 625 9% 26.32 183 36 * = 5.25 + 30.25 +4.70 + 23.50 (from Exhibit 3) ** 2010 Annual Demand *** = 6% cost of borrowing +3% other carrying costs **** Full cost from Exhibit 4 Exhibit 5 Monthly Sales Data-Cases of 12-Ounce Jars per Month Year Total Label Jan Feb Mar Apr May June July Aug Sept Oct Nov Dec Type Strawberry Jam 3JS 2012 345 301 325 299 344 296 329 334 349 325 289 333 3,869 2013 566 671 384 631 616 2,868 Marran Markets Raspberry Jelly 2012 229 270 236 279 273 255 236 232 235 276 244 241 3,006 2013 744 737 425 379 571 2,856 Kerry's Marts Peach Jam 2012 156 176 174 144 160 178 155 159 178 166 176 148 1,970 2013 167 146 78 84 117 592 Dom's Food Stores Blueberry Jam 2012 92 109 98 99 102 111 103 99 94 104 107 93 1,211 2013 100 99 80 139 108 526 AAA Grocers Apple/Mint Jelly 2012 66 77 79 69 65 66 68 67 62 74 71 68 832 2013 73 63 110 146 88 480


