

Question: After you read the case, you are required to identify the following: Summarize the case with identifying the decision required to be taken. Calculate the
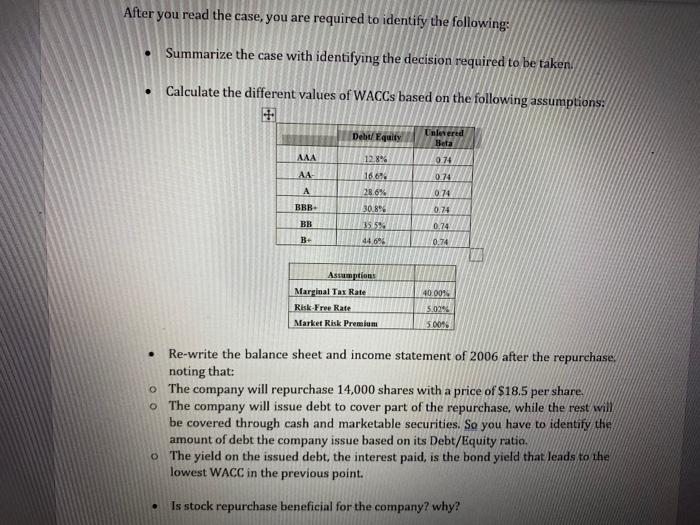
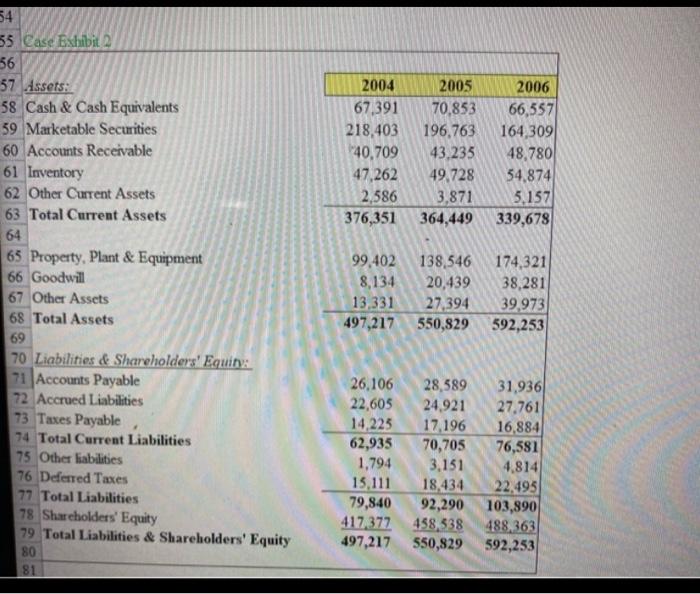
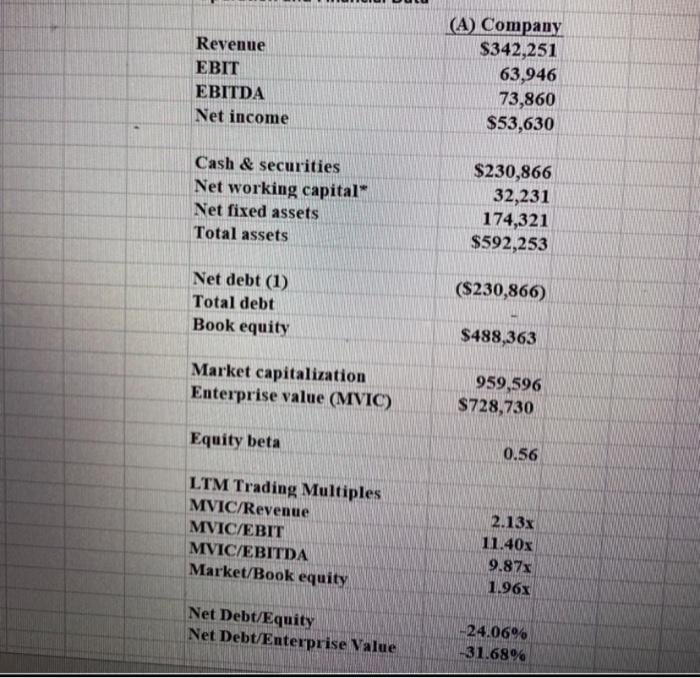
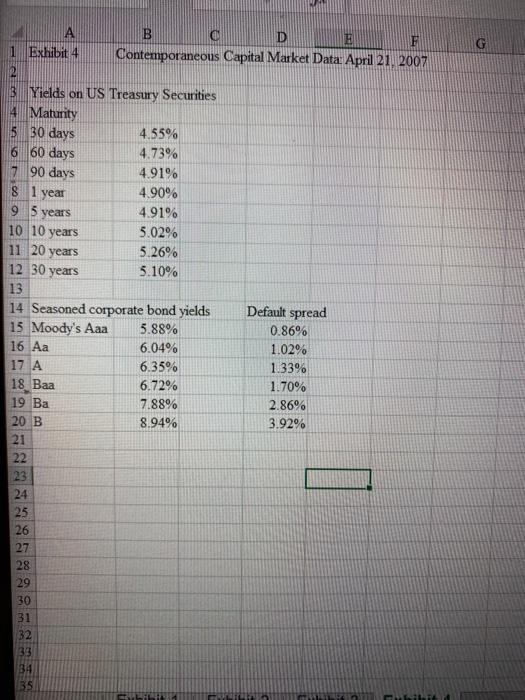
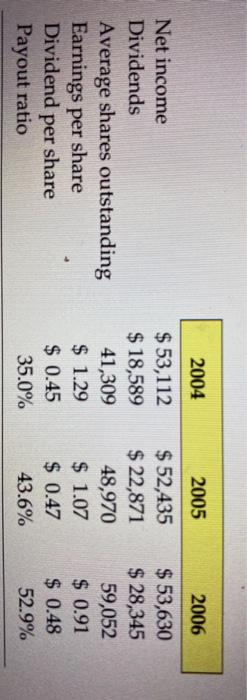
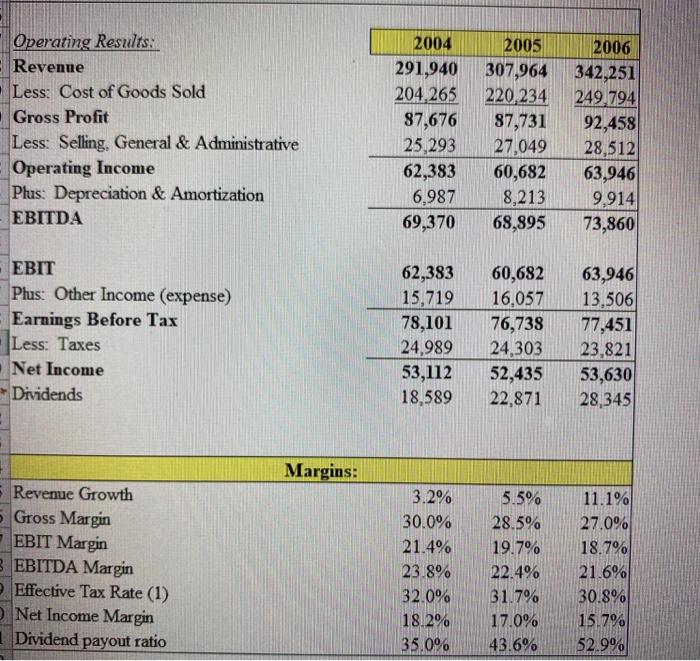
After you read the case, you are required to identify the following: Summarize the case with identifying the decision required to be taken. Calculate the different values of WACCs based on the following assumptions: Debt/ Equity Unlesered Bela AAA 12.8% 166% 074 0.74 AA 0.74 BBB . 28.6% 30.89 0.74 BB 0.74 0.74 B- 44.696 Assumptions Marginal Tax Rate Risk-Free Rate Market Risk Premium 40.00% 5.0296 5.001 Re-write the balance sheet and income statement of 2006 after the repurchase. noting that: o The company will repurchase 14,000 shares with a price of $18.5 per share o The company will issue debt to cover part of the repurchase, while the rest will be covered through cash and marketable securities. So you have to identify the amount of debt the company issue based on its Debt/Equity ratio. o The yield on the issued debt, the interest paid, is the bond yield that leads to the lowest WACC in the previous point. . Is stock repurchase beneficial for the company? why? 2004 67 391 218,403 140,709 47,262 2,586 376,351 2005 70,853 196,763 43,235 49,728 3,871 364,449 2006 66,557 164,309 48,780 54,874 5.157 339,678 54 55 Case Exhibit 56 57 Assets: 58 Cash & Cash Equivalents 59 Marketable Securities 60 Accounts Receivable 61 Inventory 62 Other Current Assets 63 Total Current Assets 64 65 Property, Plant & Equipment 66 Goodwill 67 Other Assets 68 Total Assets 69 70 Liabilities & Shareholders' Equity 71 Accounts Payable 72 Accrued Liabilities 73 Taxes Payable 74 Total Current Liabilities 75 Other liabilities 76 Deferred Taxes 77 Total Liabilities 78 Shareholders' Equity 79 Total Liabilities & Shareholders' Equity 80 81 99,402 138,546 174,321 8,134 20,439 38,281 13,331 27,394 39,973 497,217 550,829 592,253 26,106 22,605 14,225 62,935 1,794 15.111 79,840 417377 497,217 28,589 24.921 17.196 70,705 3,151 18,434 92,290 458,338 550,829 31,9361 27,761 16,884 76,581 4.814 22,495 103,890 488,363 592,253 Revenue EBIT EBITDA Net income (A) Company $342,251 63,946 73,860 $53,630 Cash & securities Net working capital Net fixed assets Total assets $230,866 32,231 174,321 $592,253 ($230,866) Net debt (1) Total debt Book equity $488,363 Market capitalization Enterprise value (MVIC) 959,596 $728,730 Equity beta 0.56 LTM Trading Multiples MVIC/Revenue MVIC/EBIT MVIC/EBITDA Market/Book equity 2.13x 11.40x 9.87x 1.96x Net Debt/Equity Net Debt/Enterprise Value -24.06% 31.68% G A B D 1 Exhibit 4 Contemporaneous Capital Market Data: April 21, 2007 2 3 Yields on US Treasury Securities 4 Maturity 5 30 days 4.55% 6 60 days 4.73% 7 90 days 4.91% 8 1 year 4.90% 9 5 years 4.91% 10 10 years 5.02% 11 20 years 5.26% 12 30 years 5.10% 13 14 Seasoned corporate bond yields Default spread 15 Moody's Aaa 5.88% 0.86% 16 Aa 6.04% 1.02% 17 A 6.35% 1.33% 18 Baa 6.72% 1.70% 19 Ba 7.88% 2.86% 20 B 8.94% 3.92% 21 22 23 24 25 26 27 28 29 30 31 32 33 34 35 2004 2005 2006 Net income Dividends Average shares outstanding Earnings per share Dividend per share Payout ratio $ 53,112 $ 18,589 41,309 $ 1.29 $ 0.45 35.0% $ 52,435 $ 22,871 48,970 $ 1.07 $ 0.47 43.6% $ 53,630 $ 28,345 59,052 $ 0.91 $ 0.48 52.9% Operating Results: Revenue Less: Cost of Goods Sold Gross Profit Less: Selling, General & Administrative Operating Income Plus: Depreciation & Amortization EBITDA 2004 291,940 204,265 87,676 25,293 62,383 6,987 69,370 2005 307,964 220,234 87,731 27,049 60,682 8,213 68,895 2006 342,251 249.794 92,458 28,512 63,946 9.914 73,860 EBIT Plus: Other Income (expense) Earnings Before Tax Less: Taxes Net Income Dividends 62,383 15,719 78,101 24,989 53,112 18,589 60,682 16.057 76,738 24,303 52,435 22,871 63,946 13,506 77,451 23,821 53,630 28,345 Margins: Revenue Growth 5 Gross Margin - EBIT Margin 3 EBITDA Margin Effective Tax Rate (1) Net Income Margin Dividend payout ratio 3.2% 30.0% 21.4% 23.8% 32.0% 18.2% 35.0% 5.5% 28.5% 19.7% 22.4% 31.7% 17.0% 43.6% 11.1% 27.0% 18.7% 21.6% 30.8% 15.7% 52.9% After you read the case, you are required to identify the following: Summarize the case with identifying the decision required to be taken. Calculate the different values of WACCs based on the following assumptions: Debt/ Equity Unlesered Bela AAA 12.8% 166% 074 0.74 AA 0.74 BBB . 28.6% 30.89 0.74 BB 0.74 0.74 B- 44.696 Assumptions Marginal Tax Rate Risk-Free Rate Market Risk Premium 40.00% 5.0296 5.001 Re-write the balance sheet and income statement of 2006 after the repurchase. noting that: o The company will repurchase 14,000 shares with a price of $18.5 per share o The company will issue debt to cover part of the repurchase, while the rest will be covered through cash and marketable securities. So you have to identify the amount of debt the company issue based on its Debt/Equity ratio. o The yield on the issued debt, the interest paid, is the bond yield that leads to the lowest WACC in the previous point. . Is stock repurchase beneficial for the company? why? 2004 67 391 218,403 140,709 47,262 2,586 376,351 2005 70,853 196,763 43,235 49,728 3,871 364,449 2006 66,557 164,309 48,780 54,874 5.157 339,678 54 55 Case Exhibit 56 57 Assets: 58 Cash & Cash Equivalents 59 Marketable Securities 60 Accounts Receivable 61 Inventory 62 Other Current Assets 63 Total Current Assets 64 65 Property, Plant & Equipment 66 Goodwill 67 Other Assets 68 Total Assets 69 70 Liabilities & Shareholders' Equity 71 Accounts Payable 72 Accrued Liabilities 73 Taxes Payable 74 Total Current Liabilities 75 Other liabilities 76 Deferred Taxes 77 Total Liabilities 78 Shareholders' Equity 79 Total Liabilities & Shareholders' Equity 80 81 99,402 138,546 174,321 8,134 20,439 38,281 13,331 27,394 39,973 497,217 550,829 592,253 26,106 22,605 14,225 62,935 1,794 15.111 79,840 417377 497,217 28,589 24.921 17.196 70,705 3,151 18,434 92,290 458,338 550,829 31,9361 27,761 16,884 76,581 4.814 22,495 103,890 488,363 592,253 Revenue EBIT EBITDA Net income (A) Company $342,251 63,946 73,860 $53,630 Cash & securities Net working capital Net fixed assets Total assets $230,866 32,231 174,321 $592,253 ($230,866) Net debt (1) Total debt Book equity $488,363 Market capitalization Enterprise value (MVIC) 959,596 $728,730 Equity beta 0.56 LTM Trading Multiples MVIC/Revenue MVIC/EBIT MVIC/EBITDA Market/Book equity 2.13x 11.40x 9.87x 1.96x Net Debt/Equity Net Debt/Enterprise Value -24.06% 31.68% G A B D 1 Exhibit 4 Contemporaneous Capital Market Data: April 21, 2007 2 3 Yields on US Treasury Securities 4 Maturity 5 30 days 4.55% 6 60 days 4.73% 7 90 days 4.91% 8 1 year 4.90% 9 5 years 4.91% 10 10 years 5.02% 11 20 years 5.26% 12 30 years 5.10% 13 14 Seasoned corporate bond yields Default spread 15 Moody's Aaa 5.88% 0.86% 16 Aa 6.04% 1.02% 17 A 6.35% 1.33% 18 Baa 6.72% 1.70% 19 Ba 7.88% 2.86% 20 B 8.94% 3.92% 21 22 23 24 25 26 27 28 29 30 31 32 33 34 35 2004 2005 2006 Net income Dividends Average shares outstanding Earnings per share Dividend per share Payout ratio $ 53,112 $ 18,589 41,309 $ 1.29 $ 0.45 35.0% $ 52,435 $ 22,871 48,970 $ 1.07 $ 0.47 43.6% $ 53,630 $ 28,345 59,052 $ 0.91 $ 0.48 52.9% Operating Results: Revenue Less: Cost of Goods Sold Gross Profit Less: Selling, General & Administrative Operating Income Plus: Depreciation & Amortization EBITDA 2004 291,940 204,265 87,676 25,293 62,383 6,987 69,370 2005 307,964 220,234 87,731 27,049 60,682 8,213 68,895 2006 342,251 249.794 92,458 28,512 63,946 9.914 73,860 EBIT Plus: Other Income (expense) Earnings Before Tax Less: Taxes Net Income Dividends 62,383 15,719 78,101 24,989 53,112 18,589 60,682 16.057 76,738 24,303 52,435 22,871 63,946 13,506 77,451 23,821 53,630 28,345 Margins: Revenue Growth 5 Gross Margin - EBIT Margin 3 EBITDA Margin Effective Tax Rate (1) Net Income Margin Dividend payout ratio 3.2% 30.0% 21.4% 23.8% 32.0% 18.2% 35.0% 5.5% 28.5% 19.7% 22.4% 31.7% 17.0% 43.6% 11.1% 27.0% 18.7% 21.6% 30.8% 15.7% 52.9%
Step by Step Solution
There are 3 Steps involved in it

Get step-by-step solutions from verified subject matter experts