

Question: After your company developed a new interaction method ( Method 2 ) to potentially replace the existing one ( Method 1 ) , you conducted
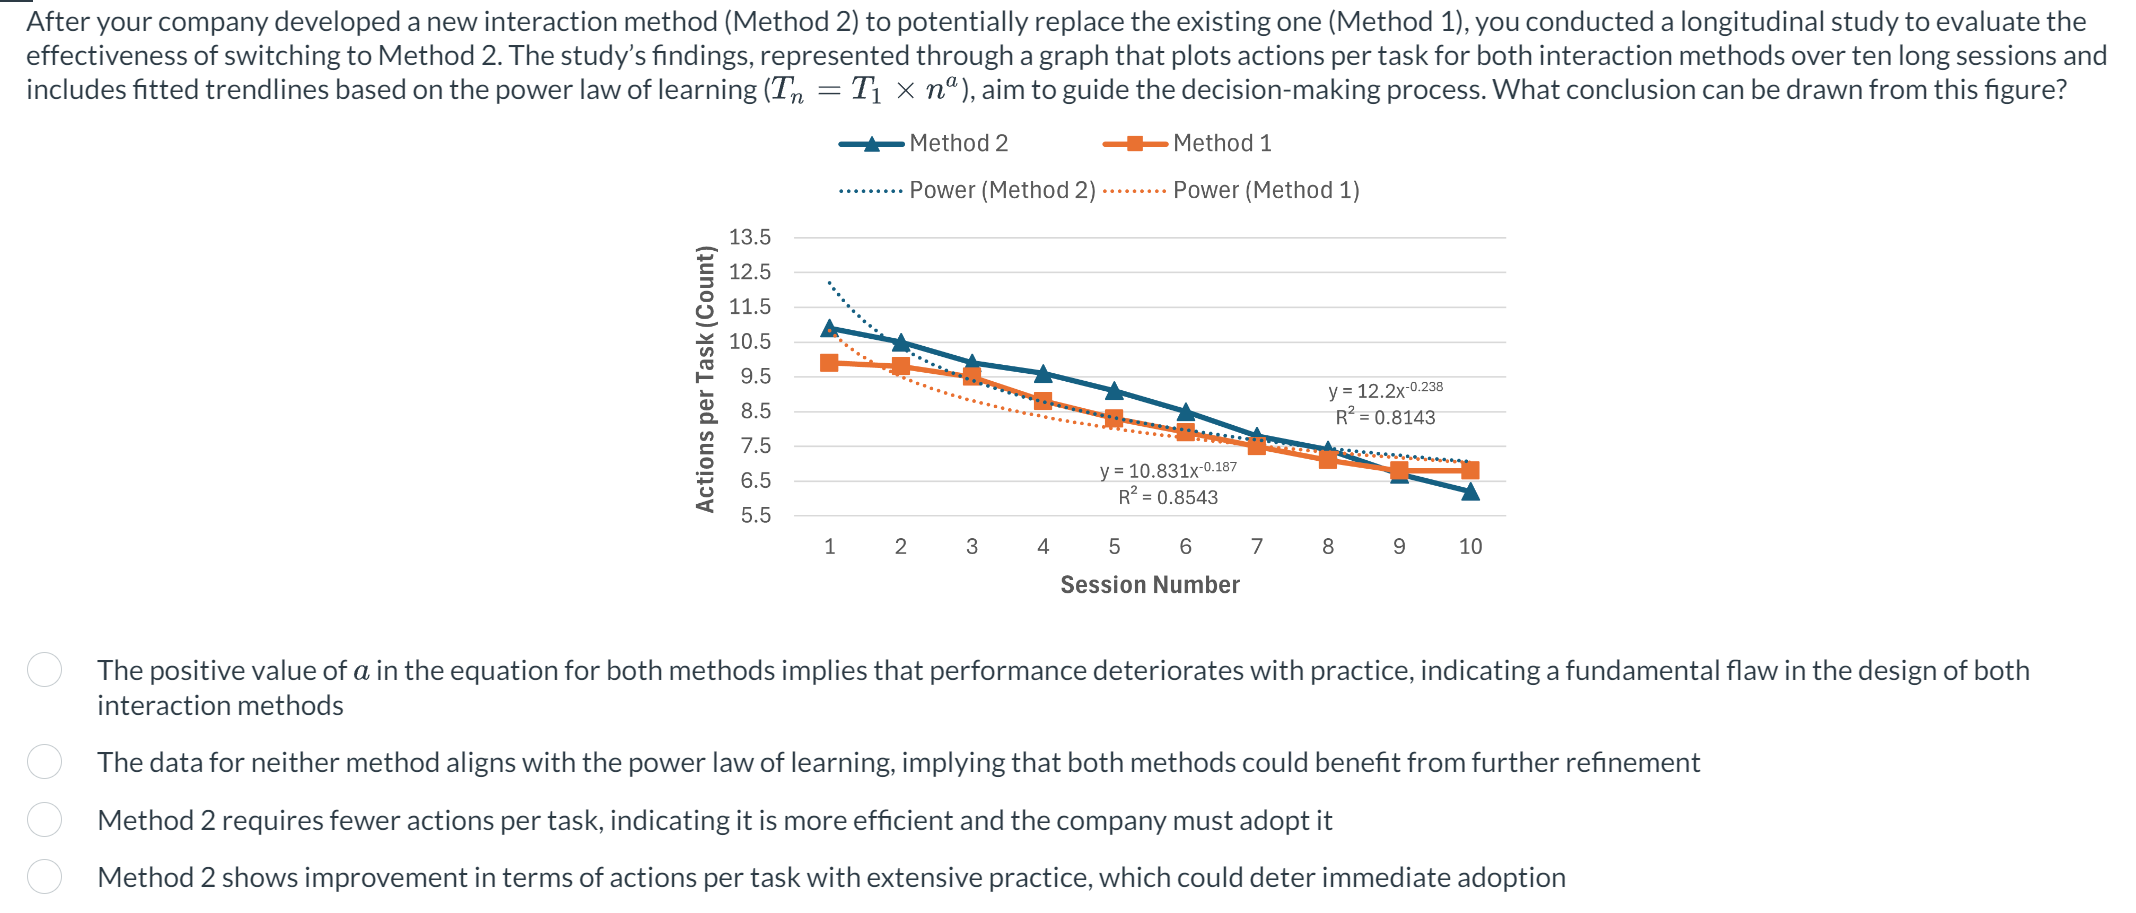
After your company developed a new interaction method Method to potentially replace the existing one Method you conducted a longitudinal study to evaluate the
effectiveness of switching to Method The study's findings, represented through a graph that plots actions per task for both interaction methods over ten long sessions and
includes fitted trendlines based on the power law of learning aim to guide the decisionmaking process. What conclusion can be drawn from this figure?
The positive value of in the equation for both methods implies that performance deteriorates with practice, indicating a fundamental flaw in the design of both
interaction methods
The data for neither method aligns with the power law of learning, implying that both methods could benefit from further refinement
Method requires fewer actions per task, indicating it is more efficient and the company must adopt it
Method shows improvement in terms of actions per task with extensive practice, which could deter immediate adoption
Step by Step Solution
There are 3 Steps involved in it
1 Expert Approved Answer
Step: 1 Unlock

Question Has Been Solved by an Expert!
Get step-by-step solutions from verified subject matter experts
Step: 2 Unlock
Step: 3 Unlock