Question: After your team has provided their input on the effect the acquisition will have on their department, perform an overall analysis to explain your recommendation

After your team has provided their input on the effect the acquisition will have on their department, perform an overall analysis to explain your recommendation to the CEO. Your analysis should include the following:

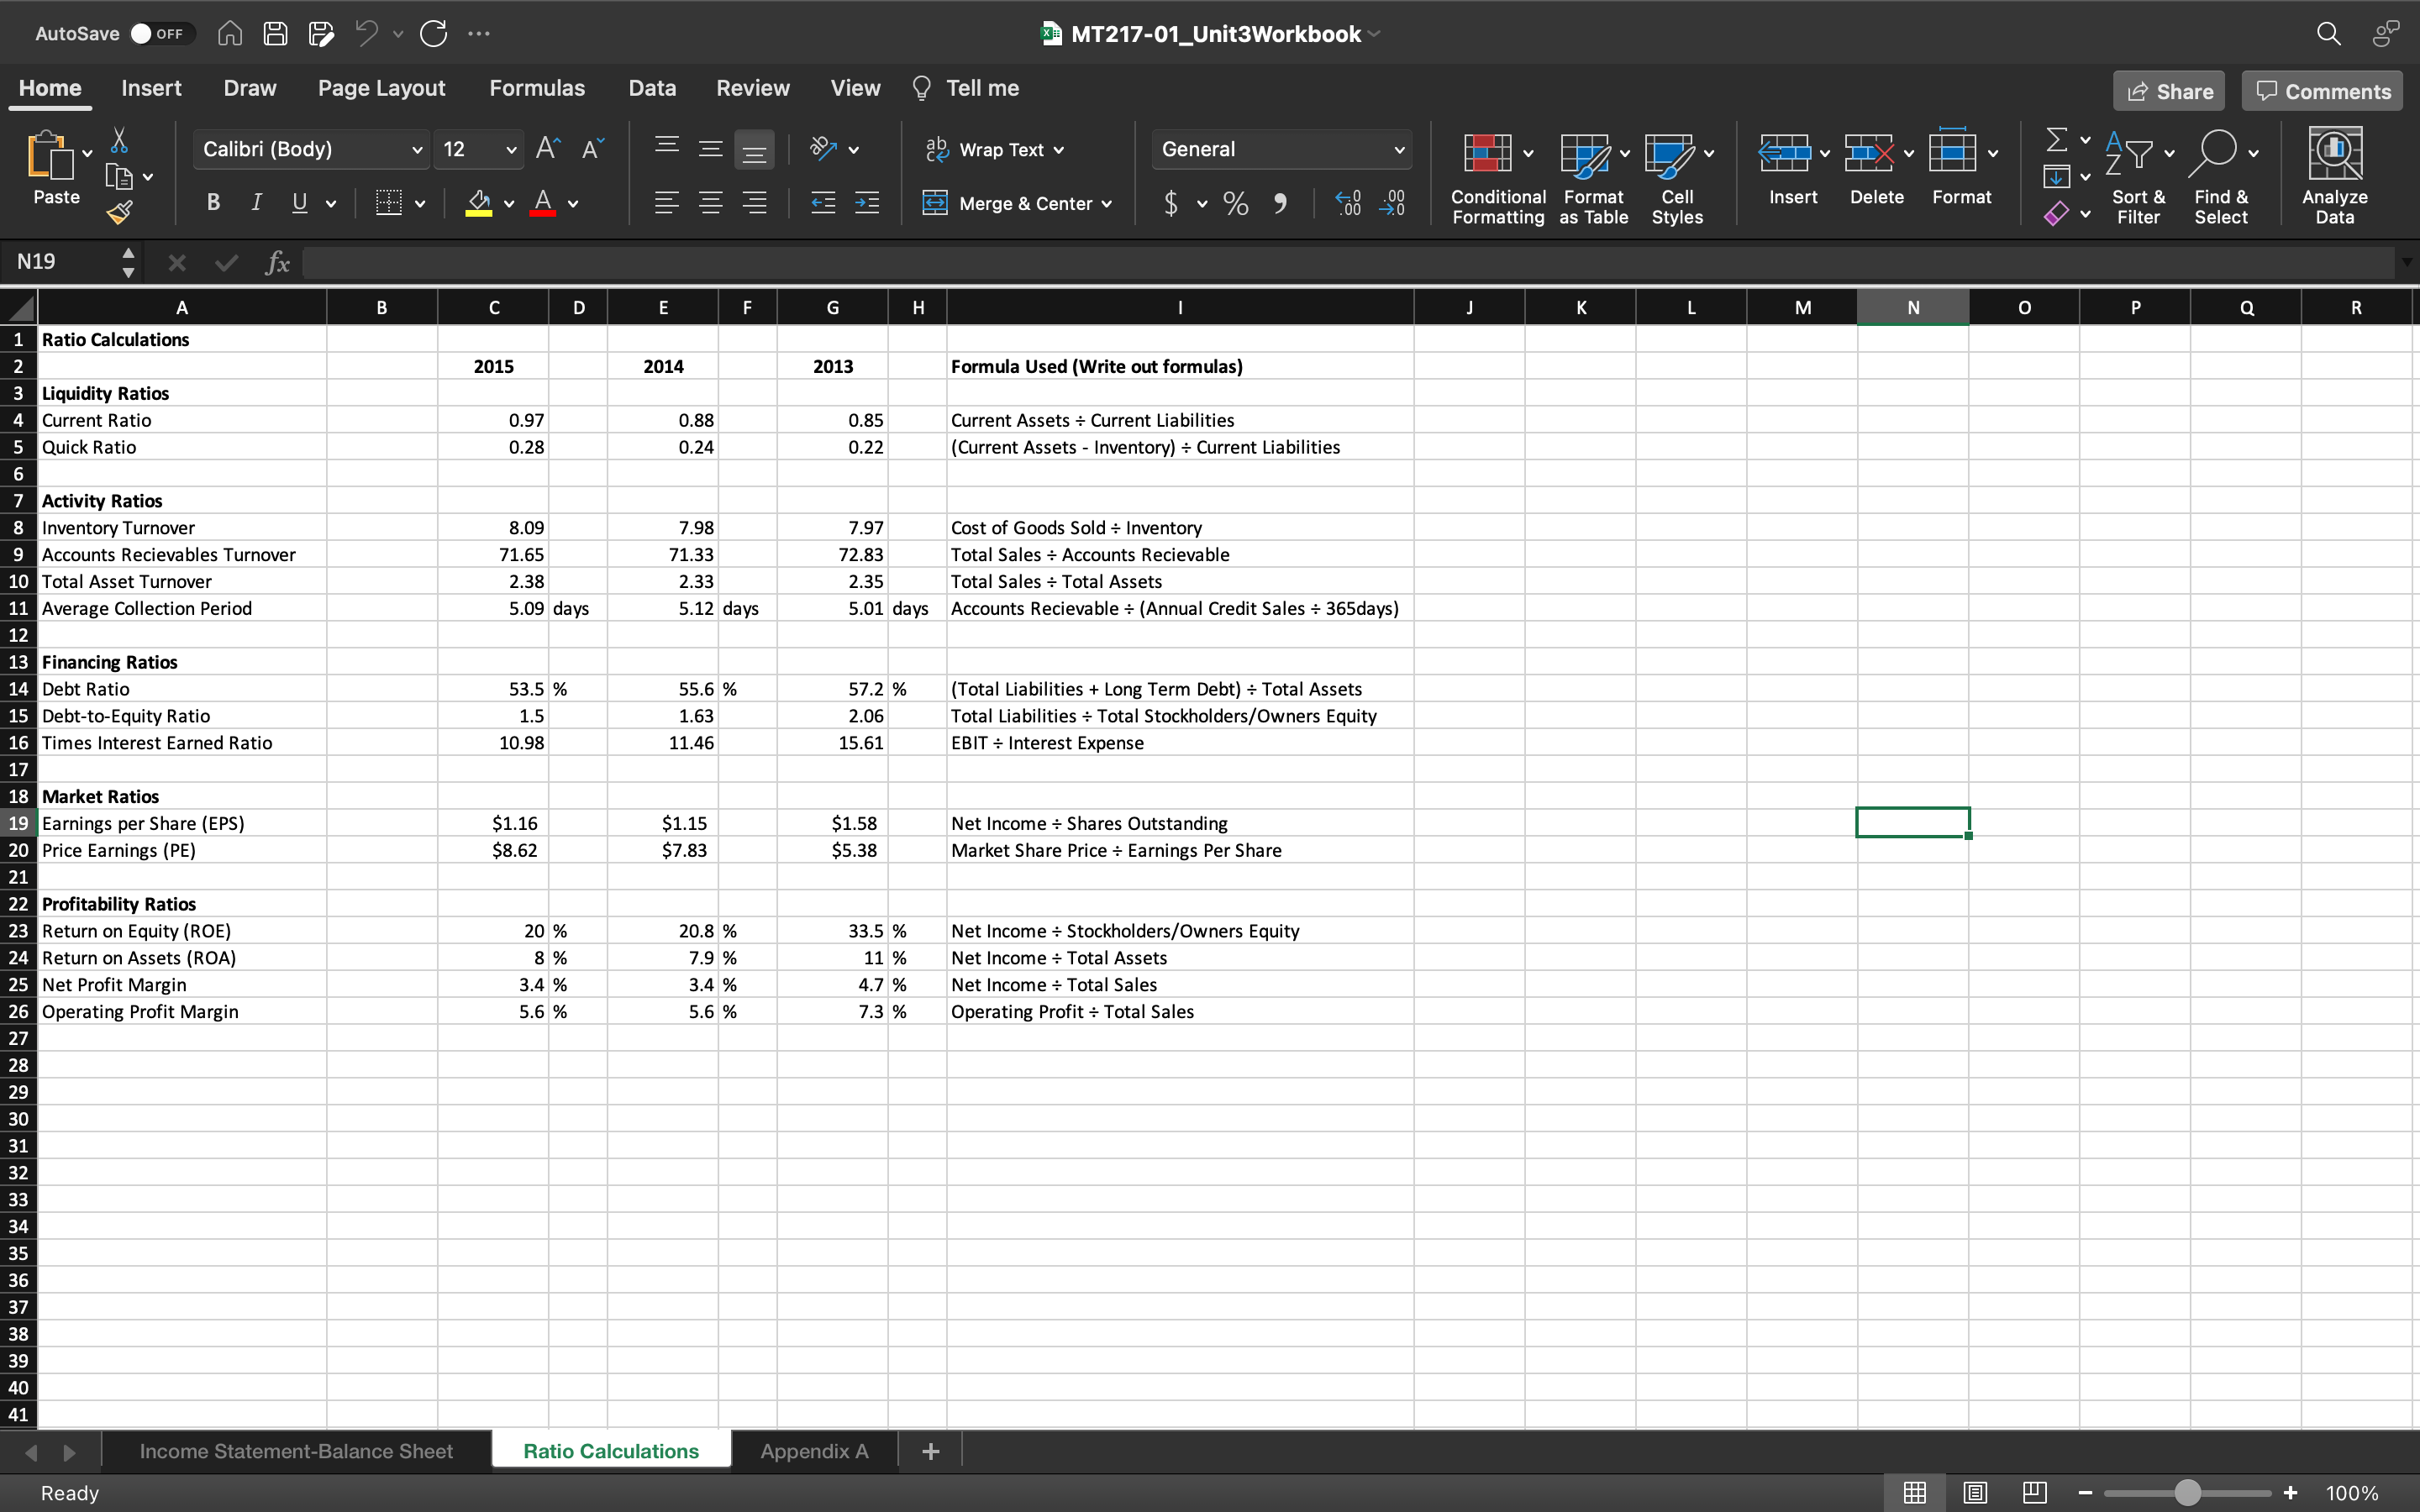
  • Explain how the company is trending based on the year-over-year ratios.
  • Compare the company to the industry average in Appendix A in the Excel workbook in areas of profitability, management effectiveness, and efficiency.
  • Based on the above, summarize the pros and cons of ABC Company using both the year-over-year ratio analysis from Part 1 and the industry average comparisons from Part 3.
  • Provide the team's final recommendation as to whether or not the CEO should invest in ABC Company.
After your team has provided their input on theAfter your team has provided their input on the
AutoSave OFF n A F G... MT217-01_Unit3Workbook Home Insert Draw Page Layout Formulas Data Review View Tell me Share Comments Calibri (Body) 12 AA D Wrap Text v General di- Paste BIUv A Merge & Center v v % 9 Conditional Format Cell Insert Delete Format Sort & Find & Analyze ormatting as Table Styles Filter Select Data N19 X V fx A B C D E F G H K L M N P R Ratio Calculations 2015 2014 2013 Formula Used (Write out formulas) Liquidity Ratios Current Ratio 0.97 0.88 0.85 Current Assets : Current Liabilities Quick Ratio 0.28 0.24 0.22 Current Assets - Inventory) : Current Liabilities Activity Ratios Inventory Turnover 8.09 7.98 7.97 Cost of Goods Sold : Inventory Accounts Recievables Turnover 71.65 71.33 72.83 Total Sales : Accounts Recievable 10 Total Asset Turnover 2.38 2.33 2.35 Total Sales : Total Assets Average Collection Period 5.09 days 5.12 days 5.01 days Accounts Recievable + (Annual Credit Sales : 365days) 13 Financing Ratios 14 Debt Ratio 53.5 % 55.6 % 57.2 % (Total Liabilities + Long Term Debt) : Total Assets 15 Debt-to-Equity Ratio 1.5 1.63 2.06 Total Liabilities : Total Stockholders/Owners Equity 16 Times Interest Earned Ratio 10.98 11.46 15.61 EBIT : Interest Expense 18 Market Ratios 19 Earnings per Share (EPS) $1.16 $1.15 $1.58 Net Income : Shares Outstanding 0 Price Earnings (PE) $8.62 $7.83 $5.38 Market Share Price : Earnings Per Share 21 Profitability Ratios 23 Return on Equity (ROE) 20 % 20.8 % 33.5 % Net Income : Stockholders/Owners Equity Return on Assets (ROA) 8 % 7.9 % 11 % Net Income : Total Assets 25 Net Profit Margin 3.4 % 3.4 % 4.7 % Net Income : Total Sales 26 Operating Profit Margin 5.6% 5.6 % 7.3% Operating Profit : Total Sales Income Statement-Balance Sheet Ratio Calculations Appendix A + Ready 100%AutoSave OFF H A FG... MT217-01_Unit3Workbook Home Insert Draw Page Layout Formulas Data Review View Tell me Share Comments Calibri (Body) 12 AA D Wrap Text v General di- Paste BIUV A Merge & Center v v % " Conditional Format Cell Insert Delete Format Sort & Find & Analyze Formatting as Table Styles Filter Select Data A1 V fx Appendix A B C D E F G H K M N O P Q R S U V W Appendix A Technology 3-Year Average for Industry Averages Profitability 6 Gross Margin 66.15% Operating Profit Margin 12.04% Net Profit Margin 6.01% Earnings per Share 1.49 10 11 Management Effectiveness 12 Return on Equity 12.40% 3 Return on Assets 5.61% 14 Return on Investment 14.42 15 Quick Ratio 2.87 16 Current Ratio 2.57 Debt-to-Equity 61.01% 18 Total Debt to Equity 57.08% 19 20 Efficiency 21 Total Asset Turnover 0.55 Inventory Turnover 44.9 23 Accounts Receivable Turnover 8.21 25 26 Income Statement-Balance Sheet Ratio Calculations Appendix A + Ready

Step by Step Solution

There are 3 Steps involved in it

1 Expert Approved Answer
Step: 1 Unlock blur-text-image
Question Has Been Solved by an Expert!

Get step-by-step solutions from verified subject matter experts

Step: 2 Unlock
Step: 3 Unlock

Students Have Also Explored These Related Finance Questions!