

Question: Age Formulas 30 Sample size 47 32 28 Sample mean #N/A 31 29 Sample Standard Deviation #N/A 39 25 Hypothesized Mean 34 38 31 Test
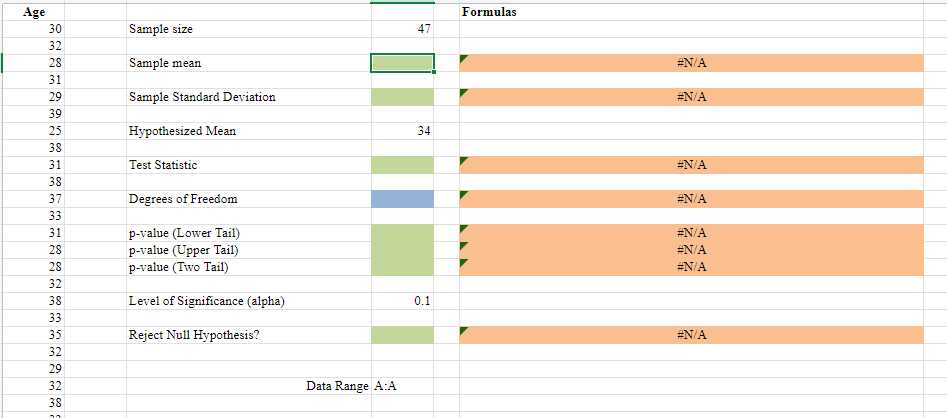
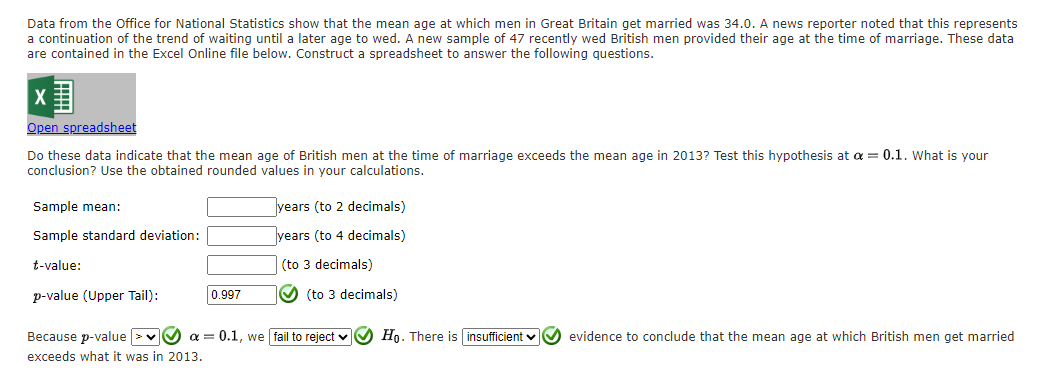
Age Formulas 30 Sample size 47 32 28 Sample mean #N/A 31 29 Sample Standard Deviation #N/A 39 25 Hypothesized Mean 34 38 31 Test Statistic #N/A 38 37 Degrees of Freedom #N/A 33 31 p-value (Lower Tail) #N/A 28 p-value (Upper Tail) #N/A 28 p-value (Two Tail) #N/A 32 38 Level of Significance (alpha) 0.1 33 35 Reject Null Hypothesis? #N/A 32 29 32 Data Range A:A 38Data from the Office for National Statistics show that the mean age at which men in Great Britain get married was 34.0. A news reporter noted that this represents a continuation of the trend of waiting until a later age to wed. A new sample of 47 recently wed British men provided their age at the time of marriage. These data are contained in the Excel Online file below. Construct a spreadsheet to answer the following questions. Open spreadshest Do these data indicate that the mean age of British men at the time of marriage exceeds the mean age in 20137 Test this hypothesis at a = 0.1. What is your conclusion? Use the obtained rounded values in your calculations. Sample mean: |:|~/ears (to 2 decimals) Sample standard deviation: |:|years (to 4 decimals) t-value: [ |(to3decimals) p-value (Upper Tail): @ {to 3 decimals) Because p-value @ o = 0.1, we |fail to reject v @ Hy. There is @ evidence to conclude that the mean age at which British men get married exceeds what it was in 2013
Step by Step Solution
There are 3 Steps involved in it

Get step-by-step solutions from verified subject matter experts