

Question: Aggregate Demand End of Chapter Problem In the graphs below, indicate the effects of the policy changes described, assuming a marginal propensity to consume (MPC)
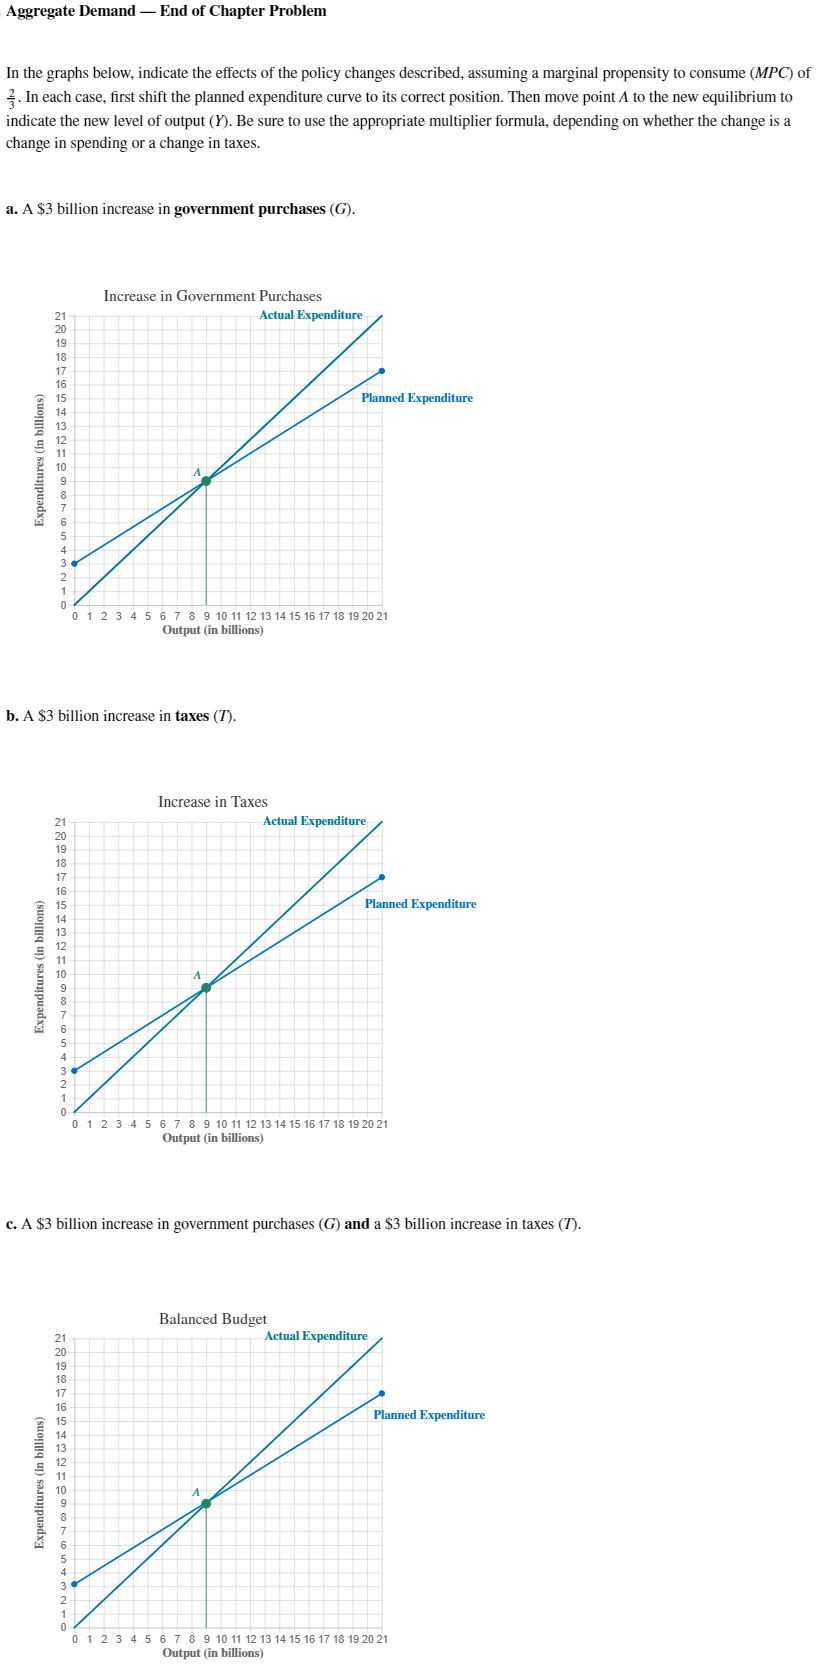
Aggregate Demand End of Chapter Problem In the graphs below, indicate the effects of the policy changes described, assuming a marginal propensity to consume (MPC) of 32. In each case, first shift the planned expenditure curve to its correct position. Then move point A to the new equilibrium to indicate the new level of output (Y). Be sure to use the appropriate multiplier formula, depending on whether the change is a change in spending or a change in taxes. a. A $3 billion increase in government purchases (G). b. A $3 billion increase in taxes (T). c. A $3 billion increase in government purchases (G) and a $3 billion increase in taxes (T)
Step by Step Solution
There are 3 Steps involved in it
1 Expert Approved Answer
Step: 1 Unlock

Question Has Been Solved by an Expert!
Get step-by-step solutions from verified subject matter experts
Step: 2 Unlock
Step: 3 Unlock