

Question: Aggregate Structure It is unlikely that any single aggregate stockpile will have a structure ( i . e . gradation ) that will satisfy a
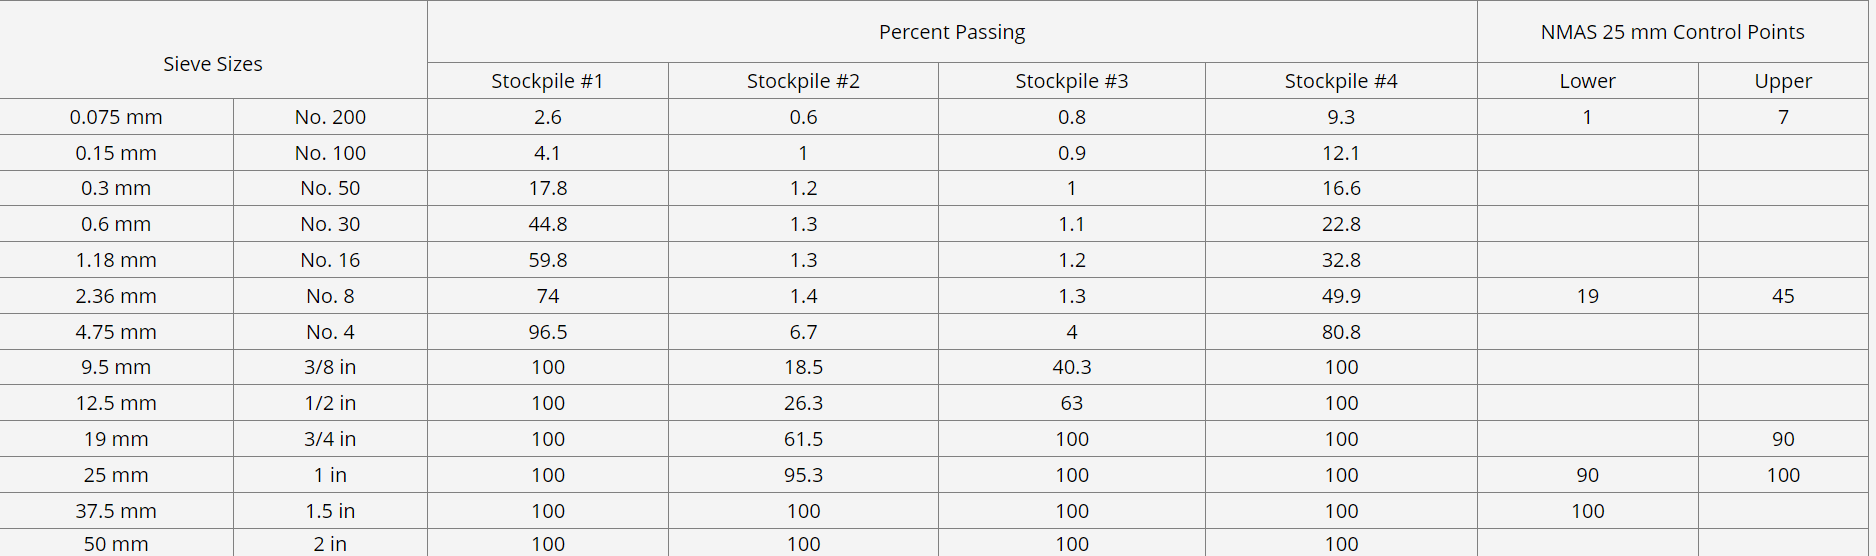
Aggregate Structure It is unlikely that any single aggregate stockpile will have a structure ie gradation that will satisfy a specific aggregate specification. Therefore, to satisfy a particular aggregate specification, multiple stockpiles are blended together. The blend is defined by the proportion of each of the source stockpiles. On Table of MS Superpave aggregate specifications are provided for NMAS mm down to NMAS mm The specification for NMAS mm inch is given in the table below along with the gradations for source stockpiles. Note that I didn't include the restricted zone in the Superpave specification as it was removed in Using a new Excel woorkbook, design an aggregate structure ie blend to satisfy the Superpave NMAS mm inch specification. Use one worksheet for your calculations. Use one worksheet for your power graph ie save the graph as a worksheet, not within a worksheet Inclulde a title and axis labels. Plot the control points for the NMAS mm inch specification on your power graph. The blend must lie between these control points. Plot the gradations for each of the stockpiles separately on your power graph. Include a legend with the stockpile plots labeled. On your calculations worksheet, design an aggregate structure using at least two of the stockpiles, such that the gradation of the blend falls within the upper and lower limits of the control points of the specification. Make sure to label input values, columns and rows on your calculations worksheet so that your design is clear for grading. Plot the aggregate structure design on your power graph. Add a label for the design plot to the legend. begintabularcccccccc
hline multicolumncmultirowbSieve Sizes & multicolumncPercent Passing & multicolumnlNMAS mm Control Points
hline & & Stockpile # & Stockpile # & Stockpile # & Stockpile # & Lower & Upper
hline mm & No & & & & & &
hline mm & No & & & & & &
hline mm & No & & & & & &
hline mm & No & & & & & &
hline mm & No & & & & & &
hline mm & No & & & & & &
hline mm & No & & & & & &
hline mm & in & & & & & &
hline mm & in & & & & & &
hline mm & in & & & & & &
hline mm & in & & & & & &
hline mm & in & & & & & &
hline mm & in & & & & & &
hline
endtabular
Step by Step Solution
There are 3 Steps involved in it
1 Expert Approved Answer
Step: 1 Unlock

Question Has Been Solved by an Expert!
Get step-by-step solutions from verified subject matter experts
Step: 2 Unlock
Step: 3 Unlock