

Question: a)Hyps: tech H0: tech H1: b)non-tech H0: non-tech H: c)Test(s): d)Dec. rule: e)Analysis: f)Conclusions: (1) (2) (3) (4) RW Associates (RWA) operates automobile dealerships in
a)Hyps:
tech H0:
tech H1:
b)non-tech H0:
non-tech H:
c)Test(s):
d)Dec. rule:
e)Analysis:
f)Conclusions: (1)
(2)
(3)
(4)
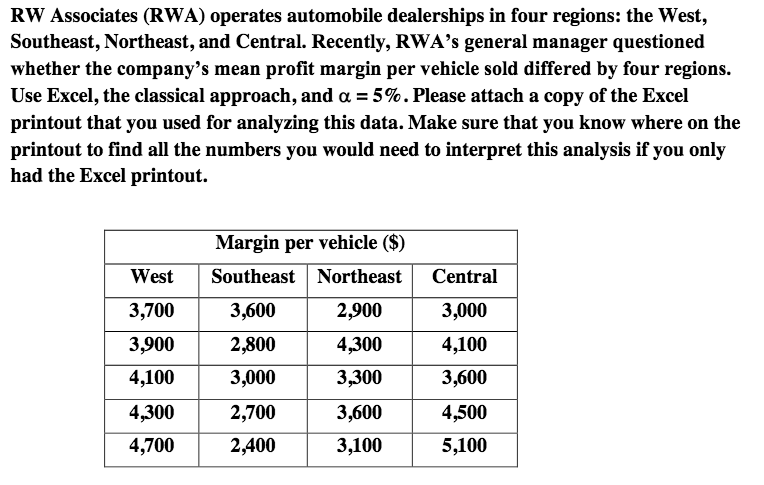
RW Associates (RWA) operates automobile dealerships in four regions: the West, Southeast, Northeast, and Central. Recently, RWA's general manager questioned whether the company's mean profit margin per vehicle sold differed by four regions. Use Excel, the classical approach, and a = 5%. Please attach a copy of the Excel printout that you used for analyzing this data. Make sure that you know where on the printout to find all the numbers you would need to interpret this analysis if you only had the Excel printout. West Central 3,700 3,900 4,100 4,300 4,700 Margin per vehicle ($) Southeast Northeast 3,600 2,900 2,800 4,300 3,000 3,300 2,700 3,600 2,400 3,100 3,000 4,100 3,600 4,500 5,100 RW Associates (RWA) operates automobile dealerships in four regions: the West, Southeast, Northeast, and Central. Recently, RWA's general manager questioned whether the company's mean profit margin per vehicle sold differed by four regions. Use Excel, the classical approach, and a = 5%. Please attach a copy of the Excel printout that you used for analyzing this data. Make sure that you know where on the printout to find all the numbers you would need to interpret this analysis if you only had the Excel printout. West Central 3,700 3,900 4,100 4,300 4,700 Margin per vehicle ($) Southeast Northeast 3,600 2,900 2,800 4,300 3,000 3,300 2,700 3,600 2,400 3,100 3,000 4,100 3,600 4,500 5,100
Step by Step Solution
There are 3 Steps involved in it

Get step-by-step solutions from verified subject matter experts