

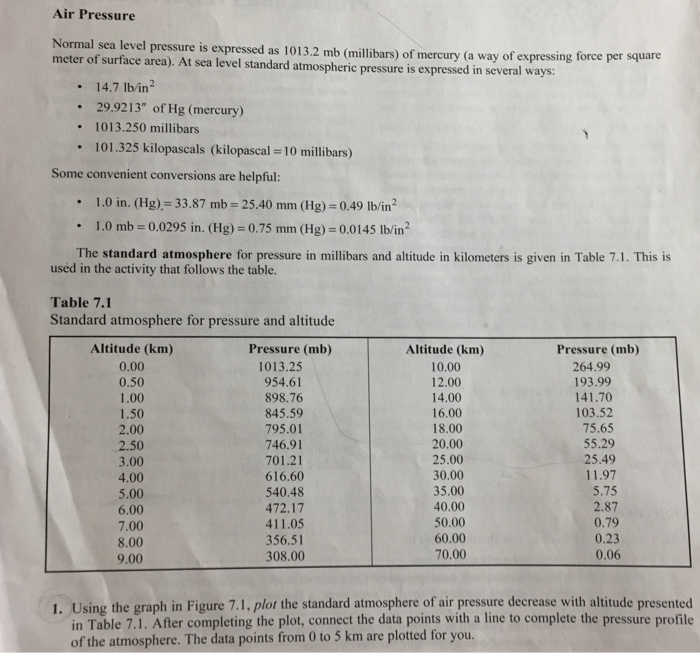
Air Pressure Normal sea level pressure is expressed as 1013.2 mb (millibars) of mercury (a way...
Fantastic news! We've Found the answer you've been seeking!
Question:
Transcribed Image Text:
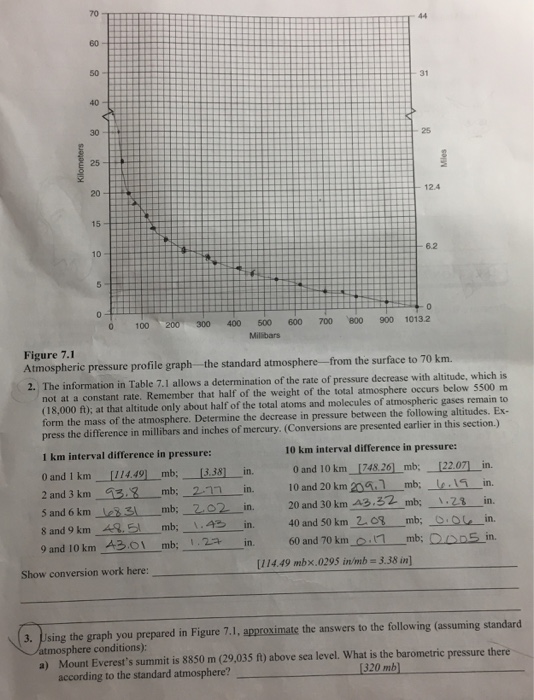
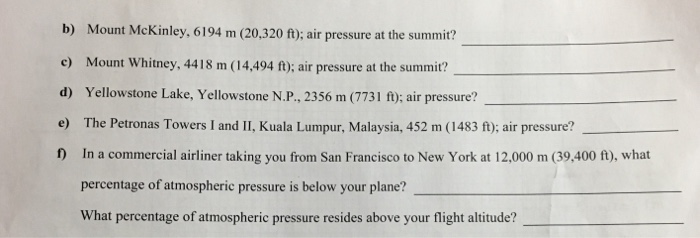
Air Pressure Normal sea level pressure is expressed as 1013.2 mb (millibars) of mercury (a way of expressing force per square meter of surface area). At sea level standard atmospheric pressure is expressed in several ways: . . 1013.250 millibars 101.325 kilopascals (kilopascal = 10 millibars) . 14.7 lb/in² 29.9213" of Hg (mercury) Some convenient conversions are helpful: . . 1.0 in. (Hg) = 33.87 mb = 25.40 mm (Hg) = 0.49 lb/in² 1.0 mb = 0.0295 in. (Hg) = 0.75 mm (Hg) = 0.0145 lb/in² The standard atmosphere for pressure in millibars and altitude in kilometers is given in Table 7.1. This is used in the activity that follows the table. Table 7.1 Standard atmosphere for pressure and altitude Altitude (km) 0.00 0.50 1.00 1.50 2.00 2.50 3.00 4.00 5.00 6.00 7.00 8.00 9.00 Pressure (mb) 1013.25 954.61 898.76 845.59 795.01 746.91 701.21 616.60 540.48 472.17 411.05 356.51 308.00 Altitude (km) 10.00 12.00 14.00 16.00 18.00 20.00 25.00 30.00 35.00 40.00 50.00 60.00 70.00 Pressure (mb) 264.99 193.99 141.70 103.52 75.65 55.29 25.49 11.97 5.75 2.87 0.79 0.23 0.06 1. Using the graph in Figure 7.1, plot the standard atmosphere of air pressure decrease with altitude presented in Table 7.1. After completing the plot, connect the data points with a line to complete the pressure profile of the atmosphere. The data points from 0 to 5 km are plotted for you. Kilometers 70 60 50- 40 30 25 20 15 10 12 5 0 100 200 300 400 0 and 1 km 2 and 3 km 5 and 6 km 8 and 9 km 9 and 10 km Show conversion work here: [3.38] [114.49] mb; mb; 2.17 3.8 8.31 mb; 202 1.43 mb; 48.51 43.01 mb; 1.27 500 Millibars in. in. 600 700 in. in. in. 800 44 31 25 12.4 Figure 7.1 Atmospheric pressure profile graph-the standard atmosphere from the surface to 70 km. 2. The information in Table 7.1 allows a determination of the rate of pressure decrease with altitude, which is not at a constant rate. Remember that half of the weight of the total atmosphere occurs below 5500 m (18,000 ft); at that altitude only about half of the total atoms and molecules of atmospheric gases remain to form the mass of the atmosphere. Determine the decrease in pressure between the following altitudes. Ex- press the difference in millibars and inches of mercury. (Conversions are presented earlier in this section.) 1 km interval difference in pressure: 6.2 0 900 1013.2 Mies 10 km interval difference in pressure: 0 and 10 km [748.26] _mb; 10 and 20 km 209.7 mb; 20 and 30 km 43.32 mb; 40 and 50 km 2.08 60 and 70 km 0.17 [114.49 mbx.0295 in/mb = 3.38 in] [22.07] in. .19 in. 1.28 in. mb; 0.0 in. mb; 0.005 in. 3. Using the graph you prepared in Figure 7.1, approximate the answers to the following (assuming standard atmosphere conditions): a) Mount Everest's summit is 8850 m (29,035 ft) above sea level. What is the barometric pressure there [320 mb] according to the standard atmosphere? b) Mount McKinley, 6194 m (20,320 ft); air pressure at the summit? c) Mount Whitney, 4418 m (14,494 ft); air pressure at the summit? d) Yellowstone Lake, Yellowstone N.P., 2356 m (7731 ft); air pressure? e) The Petronas Towers I and II, Kuala Lumpur, Malaysia, 452 m (1483 ft); air pressure? 1) In a commercial airliner taking you from San Francisco to New York at 12,000 m (39,400 ft), what percentage of atmospheric pressure is below your plane? What percentage of atmospheric pressure resides above your flight altitude? Air Pressure Normal sea level pressure is expressed as 1013.2 mb (millibars) of mercury (a way of expressing force per square meter of surface area). At sea level standard atmospheric pressure is expressed in several ways: . . 1013.250 millibars 101.325 kilopascals (kilopascal = 10 millibars) . 14.7 lb/in² 29.9213" of Hg (mercury) Some convenient conversions are helpful: . . 1.0 in. (Hg) = 33.87 mb = 25.40 mm (Hg) = 0.49 lb/in² 1.0 mb = 0.0295 in. (Hg) = 0.75 mm (Hg) = 0.0145 lb/in² The standard atmosphere for pressure in millibars and altitude in kilometers is given in Table 7.1. This is used in the activity that follows the table. Table 7.1 Standard atmosphere for pressure and altitude Altitude (km) 0.00 0.50 1.00 1.50 2.00 2.50 3.00 4.00 5.00 6.00 7.00 8.00 9.00 Pressure (mb) 1013.25 954.61 898.76 845.59 795.01 746.91 701.21 616.60 540.48 472.17 411.05 356.51 308.00 Altitude (km) 10.00 12.00 14.00 16.00 18.00 20.00 25.00 30.00 35.00 40.00 50.00 60.00 70.00 Pressure (mb) 264.99 193.99 141.70 103.52 75.65 55.29 25.49 11.97 5.75 2.87 0.79 0.23 0.06 1. Using the graph in Figure 7.1, plot the standard atmosphere of air pressure decrease with altitude presented in Table 7.1. After completing the plot, connect the data points with a line to complete the pressure profile of the atmosphere. The data points from 0 to 5 km are plotted for you. Kilometers 70 60 50- 40 30 25 20 15 10 12 5 0 100 200 300 400 0 and 1 km 2 and 3 km 5 and 6 km 8 and 9 km 9 and 10 km Show conversion work here: [3.38] [114.49] mb; mb; 2.17 3.8 8.31 mb; 202 1.43 mb; 48.51 43.01 mb; 1.27 500 Millibars in. in. 600 700 in. in. in. 800 44 31 25 12.4 Figure 7.1 Atmospheric pressure profile graph-the standard atmosphere from the surface to 70 km. 2. The information in Table 7.1 allows a determination of the rate of pressure decrease with altitude, which is not at a constant rate. Remember that half of the weight of the total atmosphere occurs below 5500 m (18,000 ft); at that altitude only about half of the total atoms and molecules of atmospheric gases remain to form the mass of the atmosphere. Determine the decrease in pressure between the following altitudes. Ex- press the difference in millibars and inches of mercury. (Conversions are presented earlier in this section.) 1 km interval difference in pressure: 6.2 0 900 1013.2 Mies 10 km interval difference in pressure: 0 and 10 km [748.26] _mb; 10 and 20 km 209.7 mb; 20 and 30 km 43.32 mb; 40 and 50 km 2.08 60 and 70 km 0.17 [114.49 mbx.0295 in/mb = 3.38 in] [22.07] in. .19 in. 1.28 in. mb; 0.0 in. mb; 0.005 in. 3. Using the graph you prepared in Figure 7.1, approximate the answers to the following (assuming standard atmosphere conditions): a) Mount Everest's summit is 8850 m (29,035 ft) above sea level. What is the barometric pressure there [320 mb] according to the standard atmosphere? b) Mount McKinley, 6194 m (20,320 ft); air pressure at the summit? c) Mount Whitney, 4418 m (14,494 ft); air pressure at the summit? d) Yellowstone Lake, Yellowstone N.P., 2356 m (7731 ft); air pressure? e) The Petronas Towers I and II, Kuala Lumpur, Malaysia, 452 m (1483 ft); air pressure? 1) In a commercial airliner taking you from San Francisco to New York at 12,000 m (39,400 ft), what percentage of atmospheric pressure is below your plane? What percentage of atmospheric pressure resides above your flight altitude?
Expert Answer:
Answer rating: 100% (QA)
3 a 320mb is given So in inches 320x00295944 in b Mount McKinley 6124m air pressure 460mb46000295 ... View the full answer

Related Book For 

The Science And Engineering Of Materials
ISBN: 9781305076761
7th Edition
Authors: Donald R. Askeland, Wendelin J. Wright
Posted Date:
Students also viewed these law questions
-
The atmospheric pressure P at altitude h = 20 km is P = 5.5 kilopascals. Estimate P at altitude h = 20.5 km assuming that dP/dh = 0.87
-
The atmospheric pressure at sea level is 14.7 pounds per square inch. Suppose that, at any elevation, an increase of 1 mile results in a decrease of 20% of the atmospheric pressure at that elevation....
-
Atmospheric pressure P decreases as altitude h increases. At a temperature of 15oC, the pressure is 101.3 kilopascals (kPa) at sea level, 87.1 kPa at h = 1 km, and 74.9 kPa at h = 2 km. Use a linear...
-
Prove that point B in Figure 18.1 is not Pareto effi cient. Food Fo FB OA Abner E C B Contract curve UAB UBB MB -Medicine Z Belinda Mo Figure 18.1 Edgeworth Box for Exchange; Pareto Efficient Points...
-
You are planning the confirmation of accounts receivable. There are 2,000 customers with a total book value of $5,643,200.Tolerable misstatement is set at $175,000 and expected misstatement is...
-
Omega Company manufactures three chemicals in a joint process. The manufacturing costs of the joint process include $25,000 of direct materials and $35,000 of conversion costs. All three chemicals...
-
Use the data for Atlantis Aquatics, Inc., from E4-21 A. Requirements 1. Prepare Atlantis Aquatics classified balance sheet. Use the account format. The balance shown for retained earnings represents...
-
Modify the guessing-game program so that the user thinks of a number that the computer must guess. The computer must make no more than the minimum number of guesses, and it must prevent the user from...
-
To ensure the process's performance, a sample took in week 21, and it was below the lower control limit. So what does Murarka need to do? please do fast and correct **** i need correct answer if...
-
CableTech Bell Corporation (CTB) operates in the telecommunications industry. CTB has two divisions: the Phone Division and the Cable Service Division. The Phone Division manufactures telephones in...
-
In Year 0, Dedalus Inc. reported earnings before taxes of $150 million and EPS of $1.2 based on 100 million shares outstanding. The payout ratio was 40% in Year 0. The stock is trading at a dividend...
-
a.) b.) int func5(int A[], int n) { } if (n100) return(0); x = A[1];) for (i = 0; i < sqrt(n); i++) { for (j = 0; j
-
Required: 1) Enter the opening balances from the August 2021 balance sheet into the general ledger accounts. Prepare journal entries for the month of September and post them to the appropriate...
-
The project I will be talking about was a marketing initiative to gain more customers for our checking and savings accounts at a local bank I worked at. There was several of us that made up the team,...
-
4. a) Consider the following set of facts: 1. X is a student. 2. X studies in CSE department. 3. X has passed HSC in the year 2016. 4. Passing year is session. 5. The students of 2016 session of CSE...
-
1) Build a Turing Machine that multiplies two integers. Explain the logic behind your design shortly. An example initial and final configuration is given below. Initial configuration:aaaaabbAAA.......
-
A trend analysis is a statistical technique used to evaluate and identify patterns, tendencies, or trends in data over a specific period ( ( Tamplin , 2 0 2 3 ) . , 2 0 2 3 ) . It involves the...
-
Vectors are drawn from the center of a regular n-sided polygon in the plane to the vertices of the polygon. Show that the sum of the vectors is zero.
-
Design an Al-Si brazing alloy and process that will be successful in joining an Al-Mn alloy that has a liquidus temperature of 659C and a solidus temperature of 656C. Brazing, like soldering,...
-
What are some of the important characteristics of sintered ceramics?
-
Sketch the M-H loop for Fe at 300 K, 500 K, and 1000 K.
-
Consider the common-base circuit in Figure 7.33 in the text. The transistor parameters are \(\beta=90, V_{E B}(\mathrm{on})=0.7 \mathrm{~V}\), and \(V_{A}=\infty\). A load capacitance of \(C_{L}=3...
-
For the circuit in Figure P7.39, the transistor parameters are: \(K_{n}=\) \(0.5 \mathrm{~mA} / \mathrm{V}^{2}, V_{T N}=2 \mathrm{~V}\), and \(\lambda=0\). Determine the maximum value of \(C_{L}\)...
-
Consider the circuit shown in Figure 7.25(a). The bias voltages are changed to \(V^{+}=3 \mathrm{~V}\) and \(V^{-}=-3 \mathrm{~V}\). The load resistor is \(R_{L}=20 \mathrm{k} \Omega\). The...

Study smarter with the SolutionInn App