

Question: An insurance medical company wants to monitor the insurance claims received at their central location. For this purpose, they review 50 claims every day
![( underline{text { P Chart Control Limits }} ) [ begin{array}{l} U C L= C L= L C L= end{array} ] Draw in the sp](https://dsd5zvtm8ll6.cloudfront.net/si.experts.images/questions/2022/11/637c8a954029d_1669106324141.jpg)
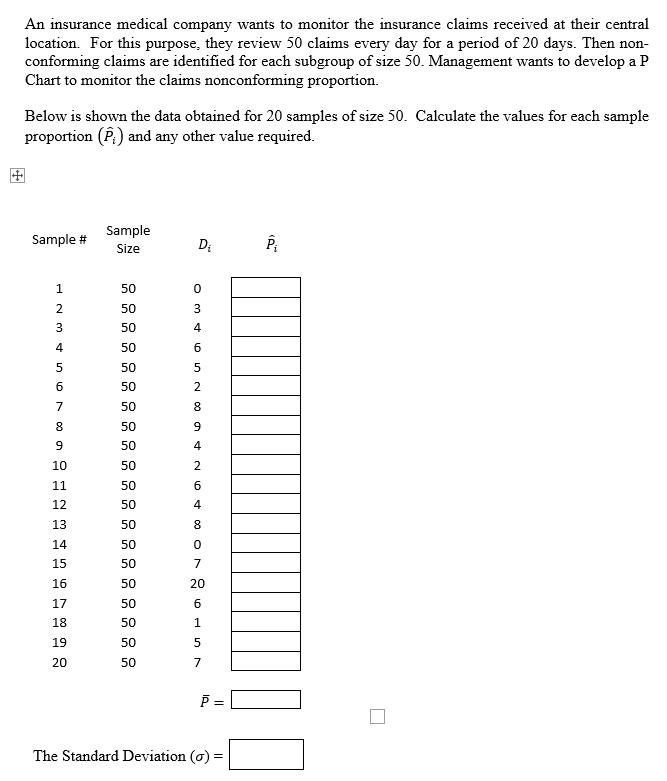
An insurance medical company wants to monitor the insurance claims received at their central location. For this purpose, they review 50 claims every day for a period of 20 days. Then non- conforming claims are identified for each subgroup of size 50. Management wants to develop a P Chart to monitor the claims nonconforming proportion. Below is shown the data obtained for 20 samples of size 50. Calculate the values for each sample proportion (P) and any other value required. Sample # LE3 in ong 1 2 4 6 7 8 9 10 11 12 13 14 15 16 17 18 19 20 Sample Size 50 50 50 50 50 50 50 50 50 50 50 50 50 50 50 50 50 50 50 50 D 0 5 1669 O A ONA CONG 8 4 8 0 20 5 P= The Standard Deviation (o)= P P Chart Control Limits UCL = CL = LCL = Draw in the space provided the P Chart
Step by Step Solution
3.40 Rating (166 Votes )
There are 3 Steps involved in it
Solution Liabilities Bills payable Sundry creditors Capital Bal ... View full answer

Get step-by-step solutions from verified subject matter experts