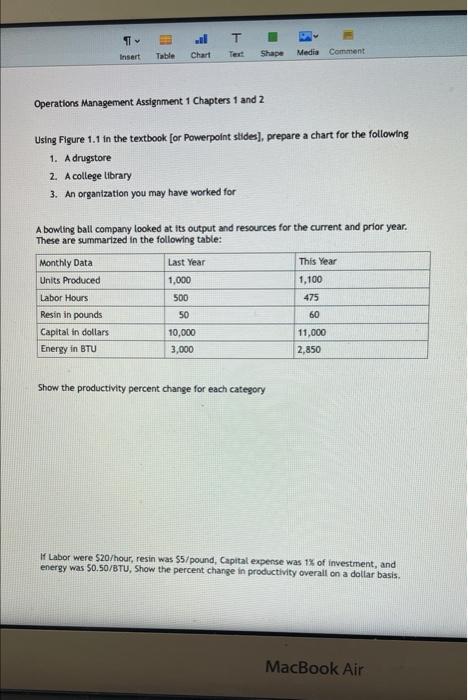
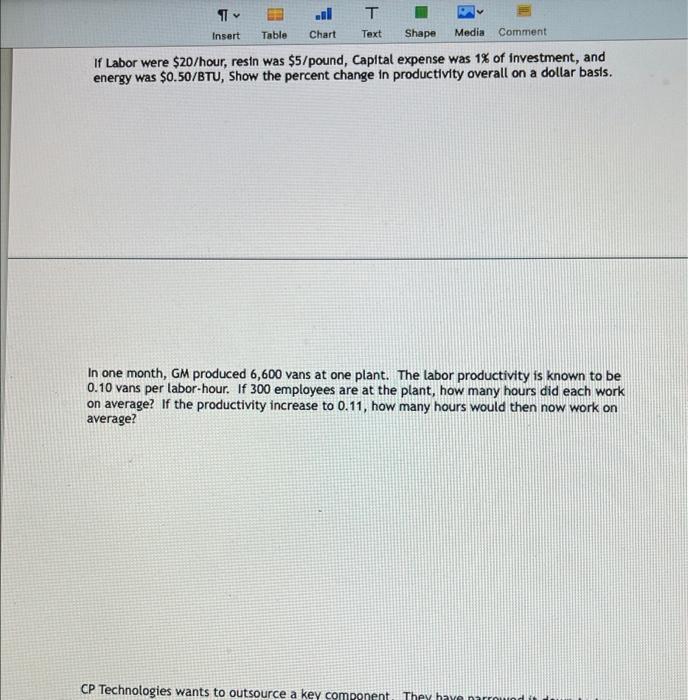
Question: al T v Insert Table Chart Text Shape Media Comment Operations Management Assignment 1 Chapters 1 and 2 Using Figure 1.1 in the textbook [or

al T v Insert Table Chart Text Shape Media
al T v Insert Table Chart Text Shape Media Comment Operations Management Assignment 1 Chapters 1 and 2 Using Figure 1.1 in the textbook [or Powerpoint stides], prepare a chart for the following 1. A drugstore 2. A college library 3. An organization you may have worked for A bowling ball company looked at its output and resources for the current and prior year. These are summarized in the following table: Monthly Data Last Year This Year Units Produced 1,000 1,100 Labor Hours 500 475 Resin in pounds 50 Capital in dollars 10,000 Energy in BTU 3,000 Show the productivity percent change for each category If Labor were $20/hour, resin was $5/pound, Capital expense was 1% of investment, and energy was 50.50/BTU, Show the percent change in productivity overall on a dollar basis. MacBook Air 60 11,000 2,850 T 1 Insert Table Chart Text Shape Media Comment If Labor were $20/hour, resin was $5/pound, Capital expense was 1% of investment, and energy was $0.50/BTU, Show the percent change in productivity overall on a dollar basis. In one month, GM produced 6,600 vans at one plant. The labor productivity is known to be 0.10 vans per labor-hour. If 300 employees are at the plant, how many hours did each work on average? If the productivity increase to 0.11, how many hours would then now work on average? CP Technologies wants to outsource a key component. They have narrowed it

Step by Step Solution

There are 3 Steps involved in it

1 Expert Approved Answer
Step: 1 Unlock blur-text-image
Question Has Been Solved by an Expert!

Get step-by-step solutions from verified subject matter experts

Step: 2 Unlock
Step: 3 Unlock

Students Have Also Explored These Related General Management Questions!