

Question: all about statistics Grade 10. Given are the two sets of data on the geometry first quarter test score of two sections in Section C
all about statistics
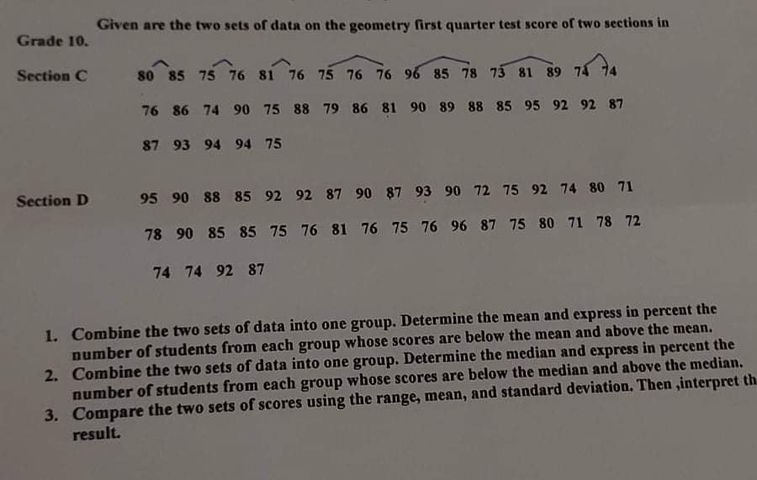
Grade 10. Given are the two sets of data on the geometry first quarter test score of two sections in Section C 80 85 75 76 81 76 75 76 76 96 85 78 73 81 89 74 76 86 74 90 75 88 79 86 81 90 89 88 85 95 92 92 87 87 93 94 94 75 Section D 95 90 88 85 92 92 87 90 87 93 90 72 75 92 74 80 71 78 90 85 85 75 76 81 76 75 76 96 87 75 80 71 78 72 74 74 92 87 1. Combine the two sets of data into one group. Determine the mean and express in percent the number of students from each group whose scores are below the mean and above the mean. 2. Combine the two sets of data into one group. Determine the median and express in percent the number of students from each group whose scores are below the median and above the median. 3. Compare the two sets of scores using the range, mean, and standard deviation. Then , interpret th result
Step by Step Solution
There are 3 Steps involved in it

Get step-by-step solutions from verified subject matter experts