

Question: All calculations ( including the final answer) to 2 decimal places. To obtain full credit, please show all work leading to the final answer. Question
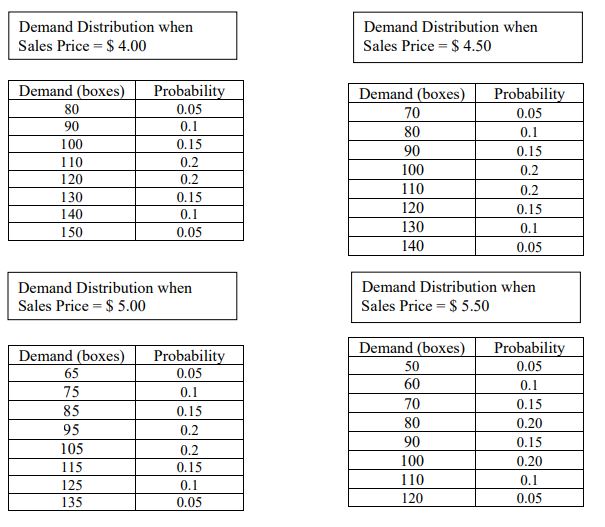
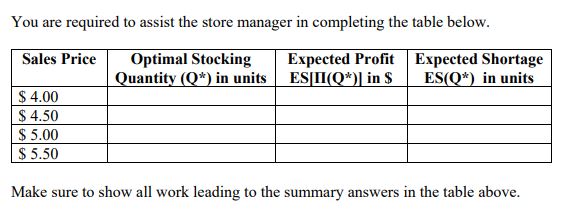
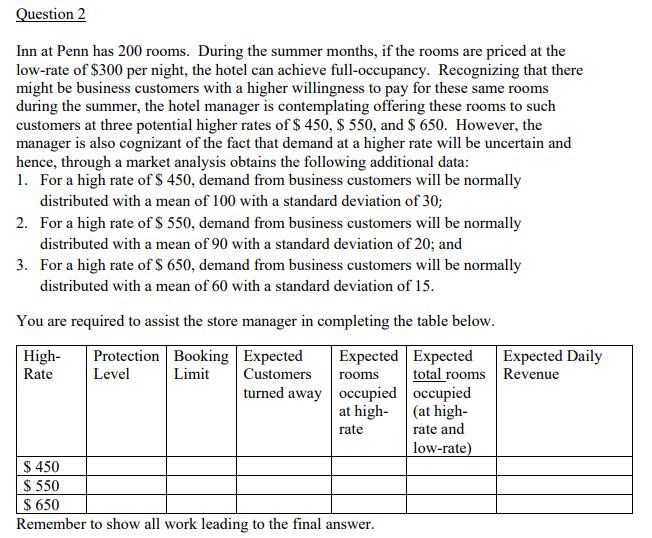
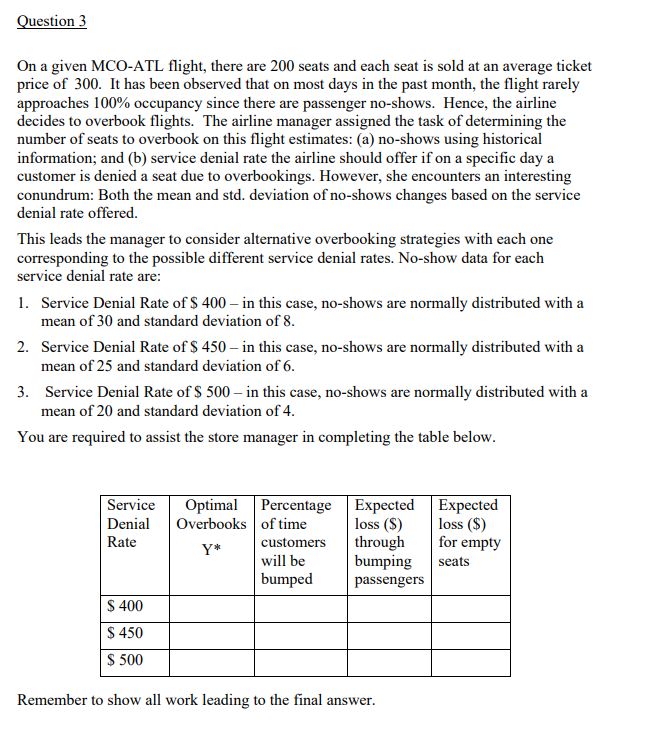
All calculations ( including the final answer) to 2 decimal places. To obtain full credit, please show all work leading to the final answer. Question 1 The Supermarket Store is about to place an order for Halloween candy. One best-selling brand of candy can be purchased at $ 2.50 per box before and up to Halloween. After Halloween, all the remaining candy can be marked down and sold for $ 1.00 per box. Assume that the loss in goodwill "cost" stemming from customers whose demand is not satisfied is $ 0.35. The store is considering a price per box of $ 4, $ 4.50, $ 5, and $ 5.50. Recognizing that demand is price dependent, through market research the store determines that demand distribution for these prices is as follows.Demand Distribution when Demand Distribution when Sales Price = $ 4.00 Sales Price = $ 4.50 Demand (boxes) Probability Demand (boxes) Probability 80 0.05 70 0.05 90 0. 1 80 100 0.15 0.1 1 10 0.2 90 0.15 120 0.2 100 0.2 130 0.15 110 0.2 140 0. 1 120 0.15 150 0.05 130 0.1 140 0.05 Demand Distribution when Demand Distribution when Sales Price = $ 5.00 Sales Price = $ 5.50 Demand (boxes) Probability Demand (boxes) Probability 65 0.05 50 0.05 75 0. 1 60 0.1 85 0.15 70 0.15 95 0.2 80 0.20 105 0.2 90 0.15 115 0.15 100 0.20 125 0.1 110 0.1 135 0.05 120 0.05You are required to assist the store manager in completing the table below. Sales Price Optimal Stocking Expected Profit Expected Shortage Quantity (Q)*) in units ESII(Q*)] in $ ES(Q)*) in units $ 4.00 $ 4.50 $ 5.00 $ 5.50 Make sure to show all work leading to the summary answers in the table above.Question 2 Inn at Penn has zoo moms. During the summer months, if the moms are priced at the low-rate of $3M: pernight, the hotel can achieve dl-oocupancy. Recognizing that there might be business customers with a higher willingness to pay for these same rooms during the summer, the hotel manager is contemplating offering these rooms to such customers at three potemial higher rates of$ 45!], $ 550g and $ 650. However, the manager is also cognizant of the fact that demand at a higher rate will be uncertain and house, through a market analysis obtains the following additional data: 1. For a high rate of S 451], demand from business customers will he normally distributed with a mean of l with a standard deviation of 30; 2. For a high rate of $ 551}, demand from business cuntomem will be normally distributed with a mean of 9G with a standard deviation of El]; and 3. For a high rate of S . demand from business customers will be normally distributed with a mean of t} with a standard deviation of 15. You are required to assist the store manager in completing the table below. Eitpected Daily Revenue Reinember to show all work leading to the nal answer. 5 luestion 3 On a given MCD-ATL flight, there are 200 seats and each seat is sold at an average ticket price of Silt]. It has been observed that on most days in the past month, the ight rarely approaches l'l'i occupancy since there are passenger no-shows. Hence, the airline decides to overhoolt ights. The airline manager assigned the task of determining the number of seats to overbook on this ight estimates: (a) no-shows using historical infomiation; and {b} service denial rate the airline should offer if on a specic day a customer is denied a seat due to overhoolrings. However. she encounters an interesting conundrum: Both the mean and std. deviation of no-shows changes based on the service denial rate offered. This leads the manager to consider alternative overbooking strategies with each one corresponding to the possible different service denial rates. No-shuw data for each service denial rate are: 1. Service Denial Rate of S 4'01} in this case, no-shows are normally distributed with a mean of3 and standard deviation of E. 2. Service Denial Rate of S 451} in this case. no-shows are normally distributed with a mean of25 and standard deviation of 6. 3. Service Denial Rate of S Sill} in this case, no-shows are normally distributed with a mean of2tl and standard deviation ot'4. You are required to assist the store manager in completing the table below. Remember to show all work leading to the nal
Step by Step Solution
There are 3 Steps involved in it

Get step-by-step solutions from verified subject matter experts