

Question: (All figures in millions) 2013 2014 2015 2016 Notes Payable Long-Term Debt Accounts Payable Retained Earnings Inventories Common Stock Accumulated Depreciation Cash Accruals Intangible Assets
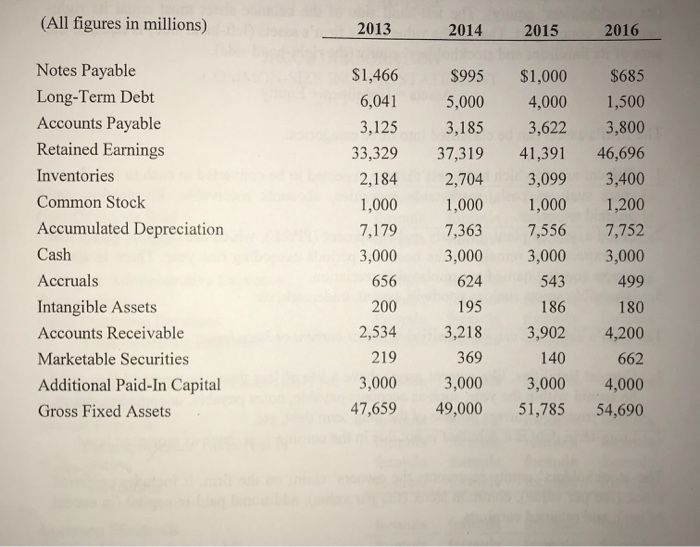
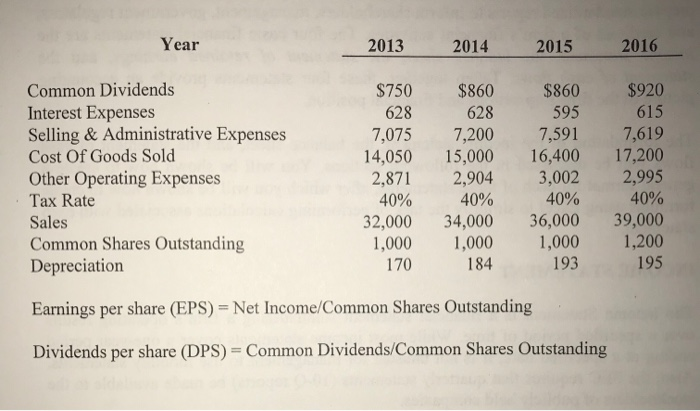
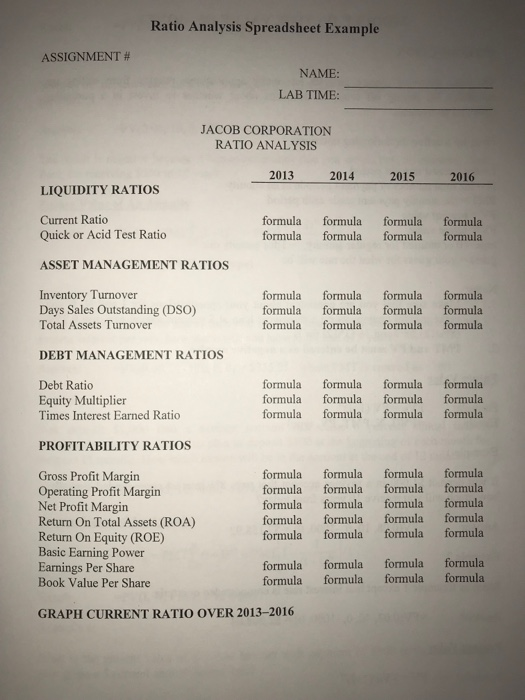
(All figures in millions) 2013 2014 2015 2016 Notes Payable Long-Term Debt Accounts Payable Retained Earnings Inventories Common Stock Accumulated Depreciation Cash Accruals Intangible Assets Accounts Receivable Marketable Securities Additional Paid-In Capital Gross Fixed Assets $1,466 $995 $1,000 $685 6,041 5,000 4,000 1,500 3,125 3,185 3,622 3,800 33,329 37,319 41,39 46,696 2,184 2,704 3,099 3,400 1,000 1,000 1,000 1,200 7,179 7,363 7,556 7,752 3,000 3,000 3,000 3,000 499 180 2,534 3,218 3,902 4,200 662 3,000 3,000 3,000 4,000 47,659 49,000 51,785 54,690 656 200 624 195 543 186 219 369 140 Year 2013 2014 2015 2016 Common Dividends Interest Expenses Selling& Administrative Expenses Cost Of Goods Solod Other Operating Expenses Tax Rate Sales Common Shares Outstanding Depreciation $750 $860 $860 $920 615 7,075 7,200 7,591 7,619 14,050 15,000 16,400 17,200 2,871 2,904 3,002 2,995 40% 32,000 34,000 36,000 39,000 1,000 1,000 1,000 1,200 195 628 628 595 40% 40% 40% 170 184 193 Earnings per share (EPS) Net Income/Common Shares Outstanding Dividends per share (DPS) Common Dividends/Common Shares Outstanding Ratio Analysis Spreadsheet Example ASSIGNMENT # NAME: LAB TIME: JACOB CORPORATION RATIO ANALYSIS 2013 2014 2015 2016 LIQUIDITY RATIOS Current Ratio Quick or Acid Test Ratio formula formula formula formula formula formula formula formula ASSET MANAGEMENT RATIOS Inventory Turnover Days Sales Outstanding (DSO) Total Assets Turnover formula formula formula formula formula formula formula formula formula formula formula formula DEBT MANAGEMENT RATIOS formula formula formula formula formula formula formula formula formula formula formula formula Debt Ratio Equity Multiplier Times Interest Earned Ratio PROFITABILITY RATIOS Gross Profit Margin Operating Profit Margin Net Profit Margin Return On Total Assets (ROA) Return On Equity (ROE) Basic Earning Power Earnings Per Share Book Value Per Share formula formula formula formula formula formula formula formula formula formula formula formula formula formula formulaformula formula formula formula formula formula formula formula formula formula formula formula formula GRAPH CURRENT RATIO OVER 2013-2016
Step by Step Solution
There are 3 Steps involved in it

Get step-by-step solutions from verified subject matter experts