

Question: All in MATLAB software and hand calculations Problem 2 An experiment conducted to estimate the variation of air kinematic viscosity with temperature yielded the following
All in MATLAB software and hand calculations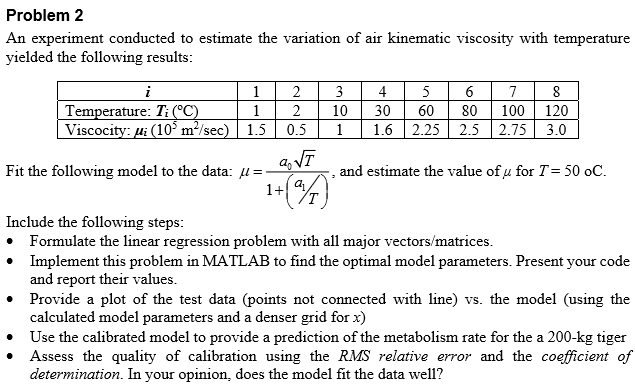
Problem 2 An experiment conducted to estimate the variation of air kinematic viscosity with temperature yielded the following results Temperature: Ti Viscocity: ?? (102 m2/sec) | 1.5 | 0.5 | 1 | 1.6 | 2.25 | 2.5 | 2.75 | 3.0 2 | 10 | 30 | 60 | 80 | 100 | 120 Fit the following model to the data: ? and estimate the value of u for T- 50 oC Include the following steps Formulate the linear regression problem with all major vectors/matrices Implement this problem in MATLAB to find the optimal model parameters. Present your code and report their values Provide a plot of the test data (points not connected with line) vs. the model (using the calculated model parameters and a denser grid for x) Use the calibrated model to provide a prediction of the metabolism rate for the a 200-kg tiger Assess the quality of calibration using the RMS relative error and the coefficient of determination. In your opinion, does the model fit the data well? Problem 2 An experiment conducted to estimate the variation of air kinematic viscosity with temperature yielded the following results Temperature: Ti Viscocity: ?? (102 m2/sec) | 1.5 | 0.5 | 1 | 1.6 | 2.25 | 2.5 | 2.75 | 3.0 2 | 10 | 30 | 60 | 80 | 100 | 120 Fit the following model to the data: ? and estimate the value of u for T- 50 oC Include the following steps Formulate the linear regression problem with all major vectors/matrices Implement this problem in MATLAB to find the optimal model parameters. Present your code and report their values Provide a plot of the test data (points not connected with line) vs. the model (using the calculated model parameters and a denser grid for x) Use the calibrated model to provide a prediction of the metabolism rate for the a 200-kg tiger Assess the quality of calibration using the RMS relative error and the coefficient of determination. In your opinion, does the model fit the data well
Step by Step Solution
There are 3 Steps involved in it

Get step-by-step solutions from verified subject matter experts