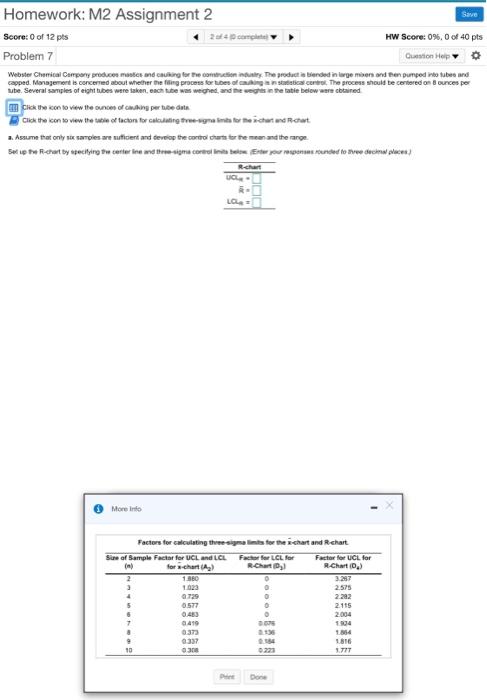
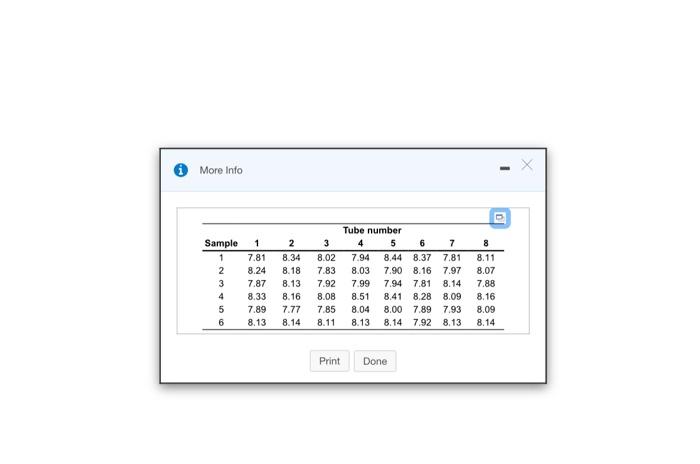
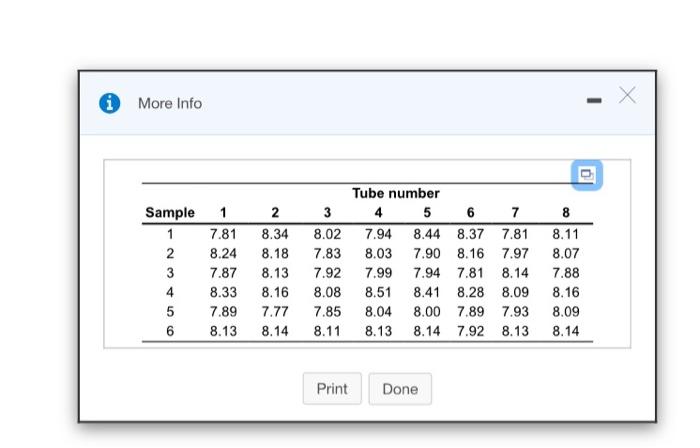
Question: all information shown Homework: M2 Assignment 2 Save Score: 0 of 12 pts HW Score: 0%60 of 40 pts Problem 7 Gestion Help Webster Chemical

all information shown Homework: M2 Assignment 2
all information shown all information shown Homework: M2 Assignment 2
all information shown Homework: M2 Assignment 2
Homework: M2 Assignment 2 Save Score: 0 of 12 pts HW Score: 0%60 of 40 pts Problem 7 Gestion Help Webster Chemical Company products and caring for the comition in the producte ended in large me and en pumped into tubes and capped. Management is concerned about whether the process forts of a cool. The process should be centered on 8 ounces per ube. Several samples of eight tubes were taken, each tube was weighed, and then the table below were obtained Click the con to view the owner of cuking per tube data Click the con to view the effector for calculating treatmerchard Rchat 2. Assume that only he samples are suferind develop the control charts for the men and the range Sot up the chart by specifying the center in and the corner onded to reduce places U LOLA More Info Factors for calculating the signals for the chart and R-chart Sure of Sample Factor for UCL and L.CL Factor for LCL. for Factor for UCL. for for chart (A) R-Chart R.Chart.) 1560 1023 2.575 . 2.282 5 0.577 2115 0.49 2004 0410 1904 337 30 1816 1.777 Done 1 More Info 1 3 Sample 1 2 3 4 5 6 7.81 8.24 7.87 8.33 7.89 8.13 2 8.34 8.18 8.13 8.16 7.77 8.14 8.02 7.83 7.92 8.08 7.85 8.11 Tube number 4 5 6 7 7.94 8.44 8.37 7.81 8.03 7.90 8.16 7.97 7.99 7.94 7.81 8.14 8.51 8.41 8.28 8.09 8.04 8.00 7.89 7.93 8.13 8.14 7.92 8.13 8 8.11 8.07 7.88 8.16 8.09 8.14 Print Done Save Homework: M2 Assignment 2 Score: 0 of 12 pts 2 of 4 (0 complete) HW Score: 0%, 0 of 40 pts Problem 7 Question Help Webster Chemical Company produces mastics and caulking for the construction industry. The product is blended in large mixers and then pumped into tubes and capped, Management is concerned about whether the filling process for tubes of caulking is in statistical control. The process should be centered on 8 ounces per tube. Several samples of eight tubes were taken, each tube was weighed, and the weights in the table below were obtained. Click the icon to view the ounces of caulking per tube data Click the icon to view the table of factors for calculating three-sigma limits for the x-chart and R-chart. a. Assume that only six samples are sufficient and develop the control charts for the mean and the range. Set up the R-chart by specifying the center line and three-sigma control limits below. (Enter your responses rounded to three decimal places.) R-chart UCLR- RE LCLR- * More Info - Sample 1 2 3 4 5 6 1 7.81 8.24 7.87 8.33 7.89 8.13 2 8.34 8.18 8.13 8.16 7.77 8.14 3 8.02 7.83 7.92 8.08 7.85 8.11 Tube number 4 5 6 7 7.94 8.44 8.37 7.81 8.03 7.90 8.16 7.97 7.99 7.94 7.81 8.14 8.51 8.41 8.28 8.09 8.04 8.00 7.89 7.93 8.13 8.14 7.92 8.13 8 8.11 8.07 7.88 8.16 8.09 8.14 Print Done * More Info Factors for calculating three-sigma limits for the x-chart and R-chart. Size of Sample Factor for UCL and LCL Factor for LCL for Factor for UCL for (n) for X-chart (A2) R-Chart (D) R-Chart (D) 2 1.880 3.267 3 1.023 2.575 4 0.729 2.282 5 0.577 2.115 6 0.483 0 2.004 7 0.419 0.076 1.924 8 0.373 0.136 1.864 9 0.337 0.184 1.816 10 0.308 0.223 1.777 OOOO Print Done

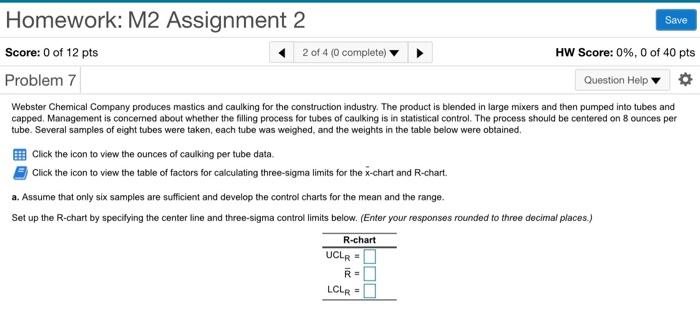
Step by Step Solution

There are 3 Steps involved in it

1 Expert Approved Answer
Step: 1 Unlock blur-text-image
Question Has Been Solved by an Expert!

Get step-by-step solutions from verified subject matter experts

Step: 2 Unlock
Step: 3 Unlock

Students Have Also Explored These Related General Management Questions!