

Question: ALL ONE QUESTION. 1. (ACCEPT/REJECT) 2. (MORE/LESS) 2. NPV/payback and simulation analysis For any investment decision, it is important for financial managers to evaluate their
 ALL ONE QUESTION.
1. (ACCEPT/REJECT)
2. (MORE/LESS)
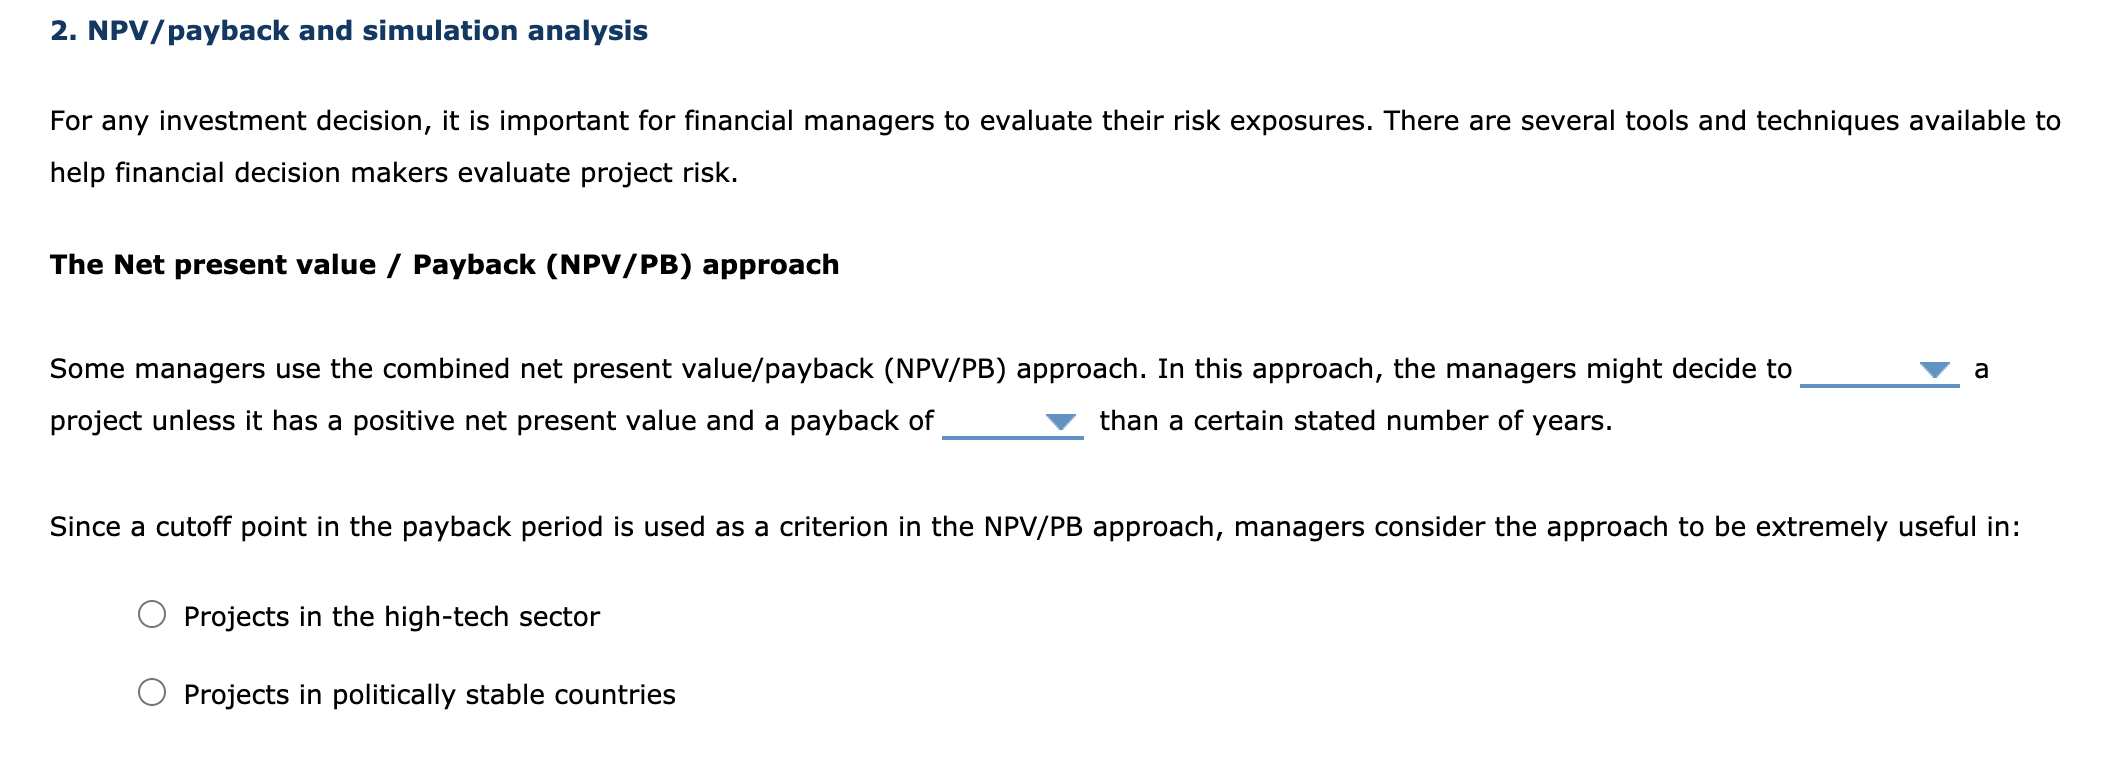
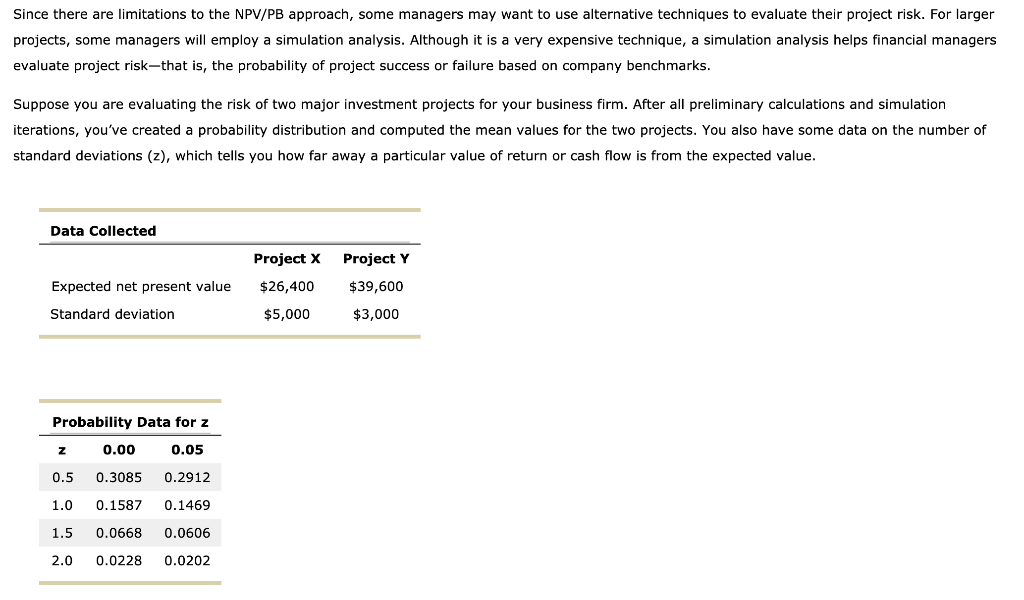
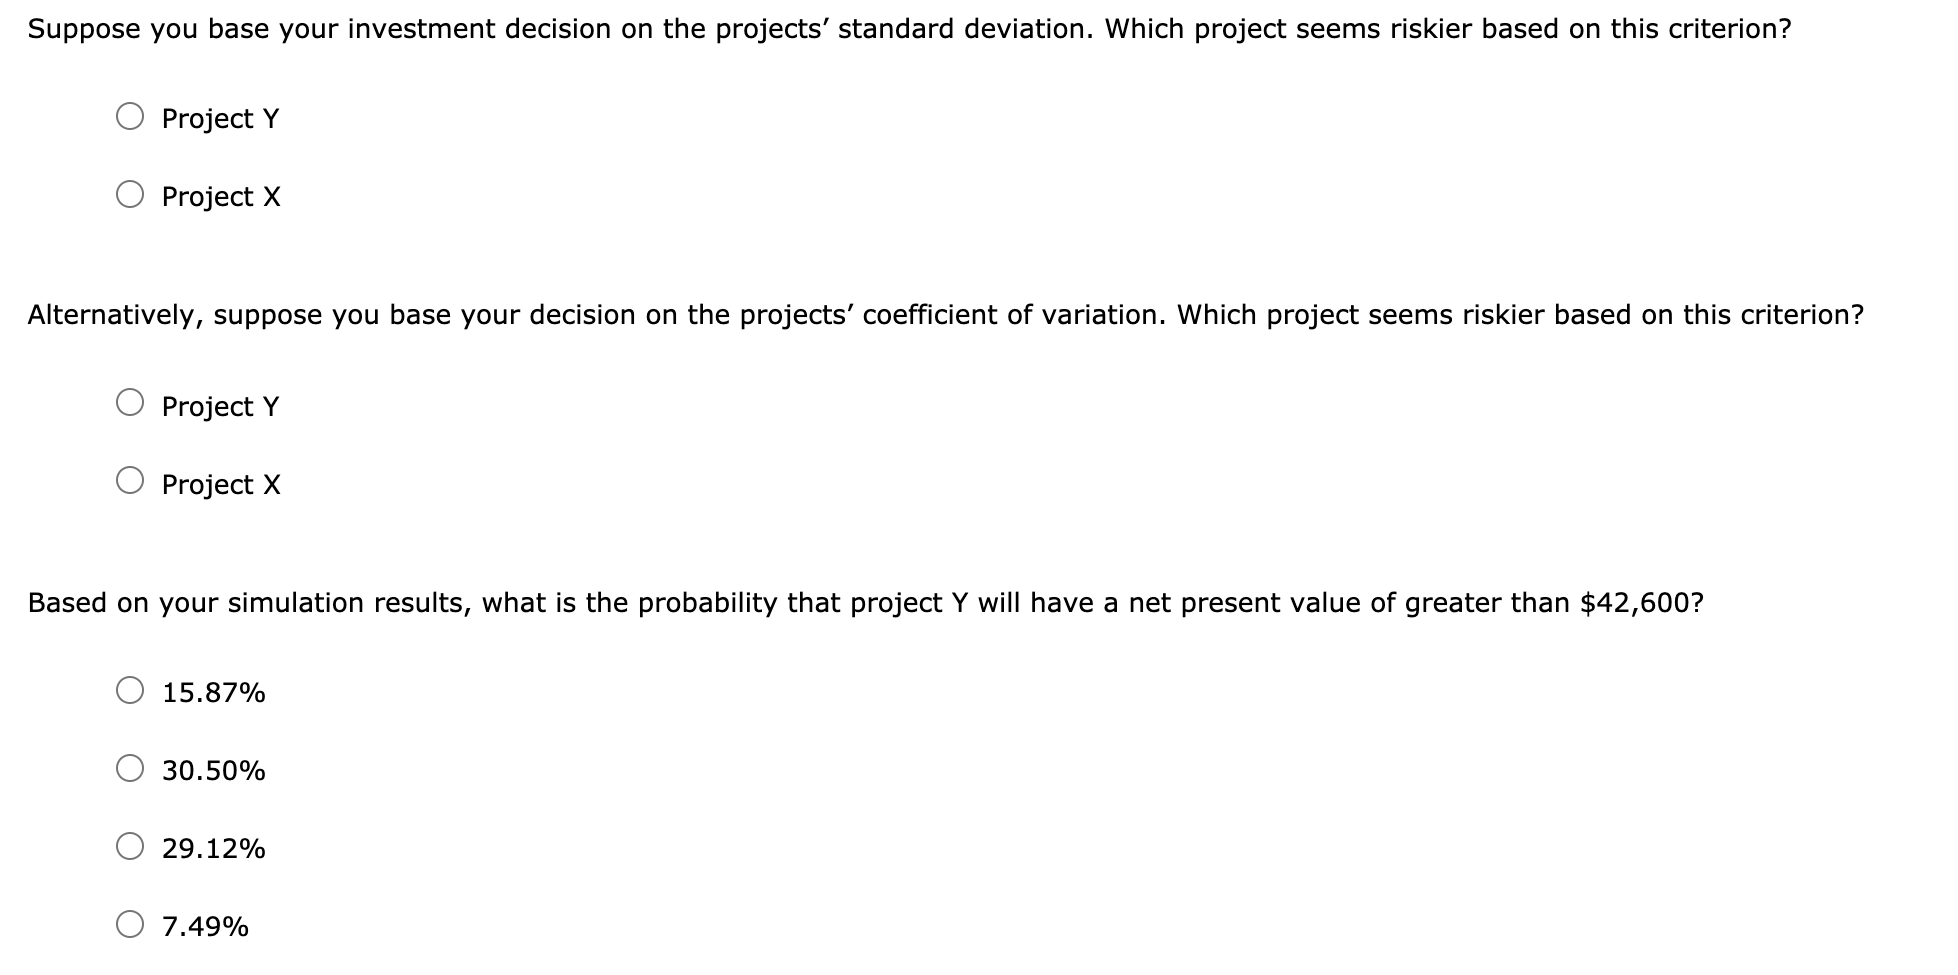
2. NPV/payback and simulation analysis For any investment decision, it is important for financial managers to evaluate their risk exposures. There are several tools and techniques available to help financial decision makers evaluate project risk. The Net present value / Payback (NPV/PB) approach a Some managers use the combined net present value/payback (NPV/PB) approach. In this approach, the managers might decide to project unless it has a positive net present value and a payback of than a certain stated number of years. Since a cutoff point in the payback period is used as a criterion in the NPV/PB approach, managers consider the approach to be extremely useful in: Projects in the high-tech sector Projects in politically stable countries Since there are limitations to the NPV/PB approach, some managers may want to use alternative techniques to evaluate their project risk. For larger projects, some managers will employ a simulation analysis. Although it is a very expensive technique, a simulation analysis helps financial managers evaluate project risk-that is, the probability of project success or failure based on company benchmarks. Suppose you are evaluating the risk of two major investment projects for your business firm. After all preliminary calculations and simulation iterations, you've created a probability distribution and computed the mean values for the two projects. You also have some data on the number of standard deviations (z), which tells you how far away a particular value of return or cash flow is from the expected value. Data Collected Project Y Project X $26,400 Expected net present value $39,600 $3,000 Standard deviation $5,000 Probability Data for z Z 0.00 0.05 0.5 0.3085 0.2912 1.0 0.1587 0.1469 1.5 0.0668 0.0606 2.0 0.0228 0.0202 Suppose you base your investment decision on the projects' standard deviation. Which project seems riskier based on this criterion? Project Y Project X Alternatively, suppose you base your decision on the projects' coefficient of variation. Which project seems riskier based on this criterion? Project Y Project X Based on your simulation results, what is the probability that project Y will have a net present value of greater than $42,600? 15.87% 30.50% 29.12% 7.49%
Step by Step Solution
There are 3 Steps involved in it

Get step-by-step solutions from verified subject matter experts