

Question: NPV/Payback and simulation analysis (Answer all please) Fill in the blank section -Accept or Reject -less or more Select the best answers for the rest.
 NPV/Payback and simulation analysis (Answer all please)
Fill in the blank section -Accept or Reject -less or more
Select the best answers for the rest.
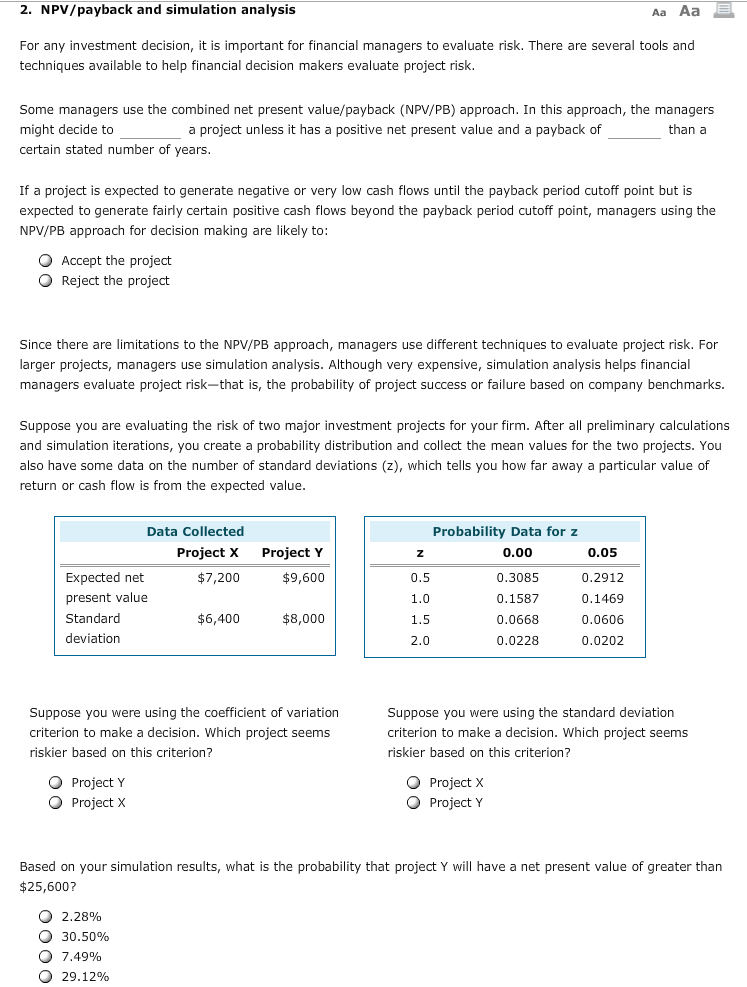
2. /payback and simulation analysis Aa Aa For any investment decision, it is important for financial managers to evaluate risk. There are several tools and techniques available to help financial decision makers evaluate project risk Some managers use the combined net present value/payback (NPV/PB) approach. In this approach, the managers might decide to a project unless it has a positive net present value and a payback of than a certain stated number of years If a project is expected to generate negative or very low cash flows until the payback period cutoff point but is expected to generate fairly certain positive cash flows beyond the payback period cutoff point, managers using the NPV/PB approach for decision making are likely to: O Accept the project O Reject the project Since there are limitations to the NPV/PB approach, managers use different techniques to evaluate project risk. For larger projects, managers use simulation analysis. Although very expensive, simulation analysis helps financial managers evaluate project risk-that is, the probability of project success or failure based on company benchmarks. Suppose you are evaluating the risk of two major investment projects for your firm. After all preliminary calculations and simulation iterations, you create a probability distribution and collect the mean values for the two projects. You also have some data on the number of standard deviations (z which tells you how far away a particular value of n or cash flow is from the expected value tur Data Collected Probability Data for z Project X Project Y 0.00 0.05 Expected net $7,200 $9,600 0.5 0.3085 0.2912 present value 0.1587 0.1469 Standard $6,400 $8,000 0.0668 0.0606 deviation 0.0228 0.0202 2.0 Suppose you were using the coefficient of variation Suppose you were using the standard deviation criterion to make a decision. Which project seems criterion to make a decision. Which project seems riskier based on this criterion? riskier based on this criterion? O Project Y O Project X O Project X O Project Y Based on your simulation results, what is the probability that project Y will have a net present value of greater than $25,600? O 2.28% O 30.50% O 7.49% O 29.12%
Step by Step Solution
There are 3 Steps involved in it

Get step-by-step solutions from verified subject matter experts