

Question: #All packages needed import numpy as np import scipy. special as spsp import scipy.stats as spspt import matplotlib.pyplot as plt fmatplotlib inline It is suggested
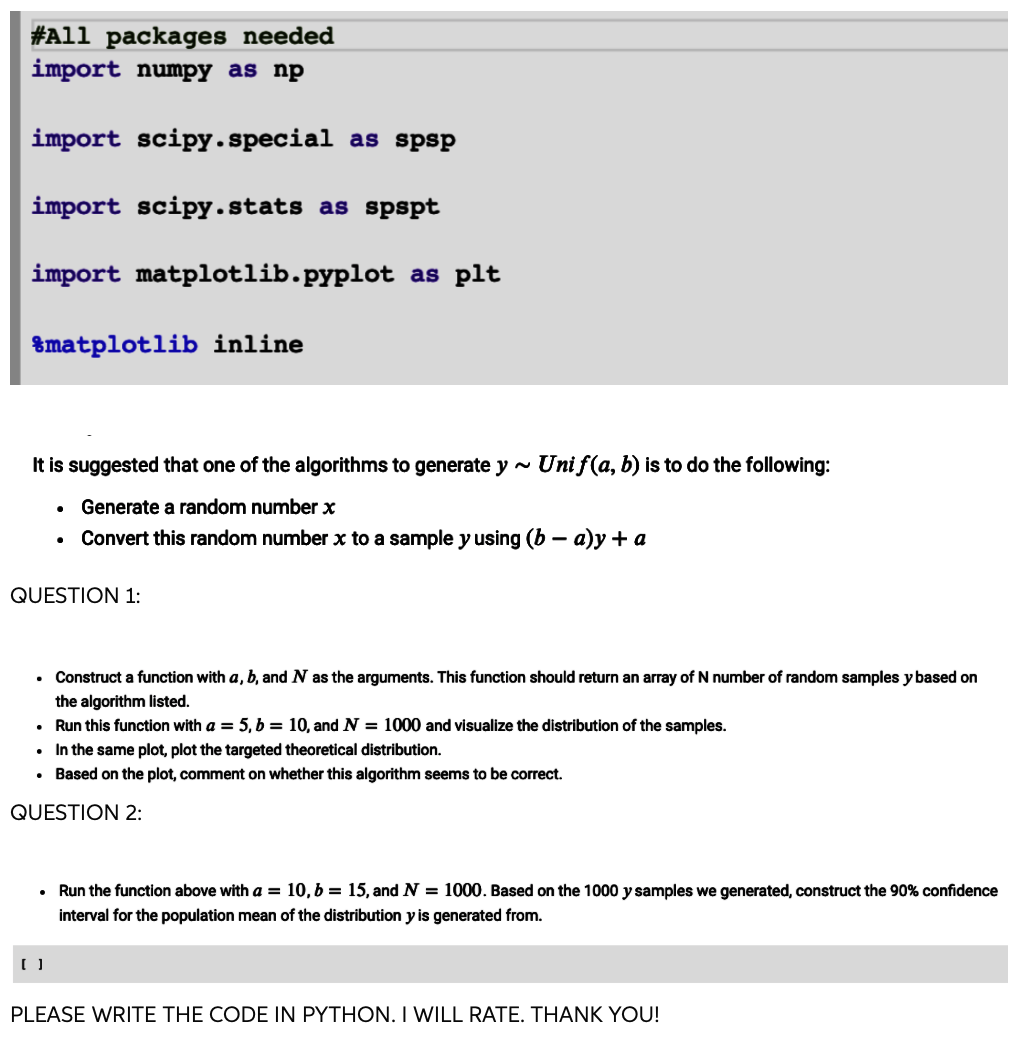
#All packages needed import numpy as np import scipy. special as spsp import scipy.stats as spspt import matplotlib.pyplot as plt fmatplotlib inline It is suggested that one of the algorithms to generate y~ Uni f(a, b) is to do the following: Generate a random number x Convert this random number x to a sample y using (b - a)y + a QUESTION 1: Construct a function with a, b, and N as the arguments. This function should return an array of N number of random samples y based on the algorithm listed. Run this function with a = 5, b = 10 and N = 1000 and visualize the distribution of the samples. In the same plot, plot the targeted theoretical distribution. Based on the plot, comment on whether this algorithm seems to be correct. QUESTION 2: Run the function above with a = 10,b= 15, and N = 1000. Based on the 1000 y samples we generated, construct the 90% confidence interval for the population mean of the distribution y is generated from U PLEASE WRITE THE CODE IN PYTHON. I WILL RATE. THANK YOU! #All packages needed import numpy as np import scipy. special as spsp import scipy.stats as spspt import matplotlib.pyplot as plt fmatplotlib inline It is suggested that one of the algorithms to generate y~ Uni f(a, b) is to do the following: Generate a random number x Convert this random number x to a sample y using (b - a)y + a QUESTION 1: Construct a function with a, b, and N as the arguments. This function should return an array of N number of random samples y based on the algorithm listed. Run this function with a = 5, b = 10 and N = 1000 and visualize the distribution of the samples. In the same plot, plot the targeted theoretical distribution. Based on the plot, comment on whether this algorithm seems to be correct. QUESTION 2: Run the function above with a = 10,b= 15, and N = 1000. Based on the 1000 y samples we generated, construct the 90% confidence interval for the population mean of the distribution y is generated from U PLEASE WRITE THE CODE IN PYTHON. I WILL RATE. THANK YOU
Step by Step Solution
There are 3 Steps involved in it

Get step-by-step solutions from verified subject matter experts