

Question: all that is needed is a common size income statement. the pictures are just all the info provided in the book Prepare a common size

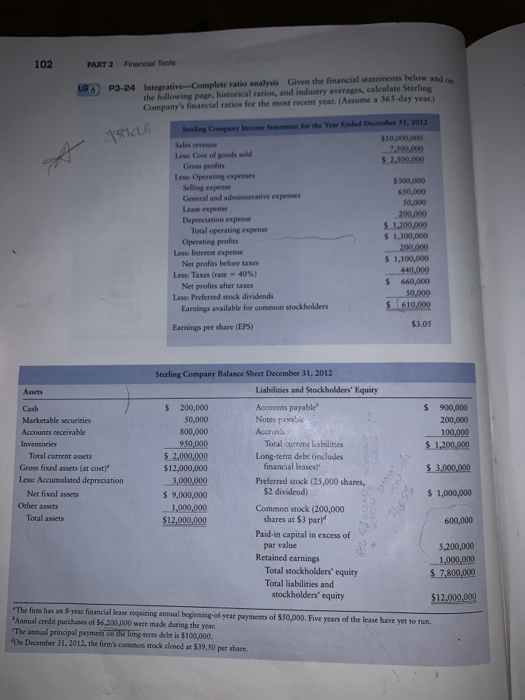
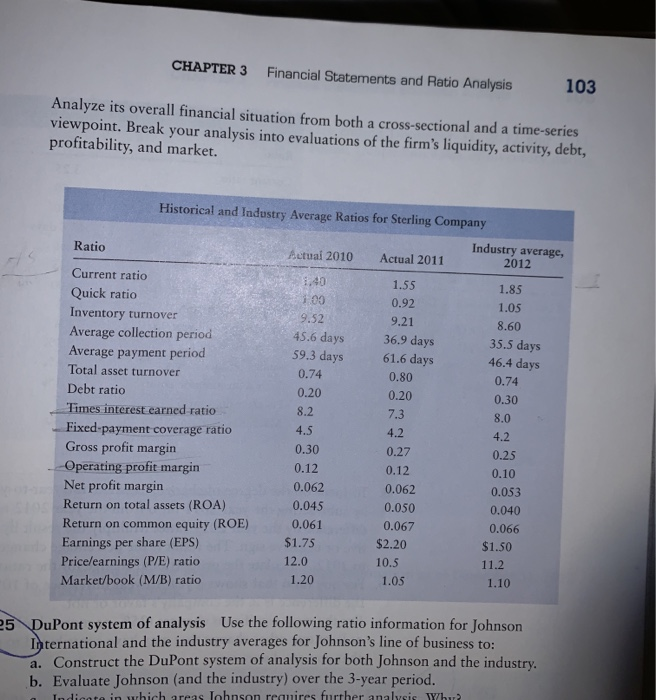
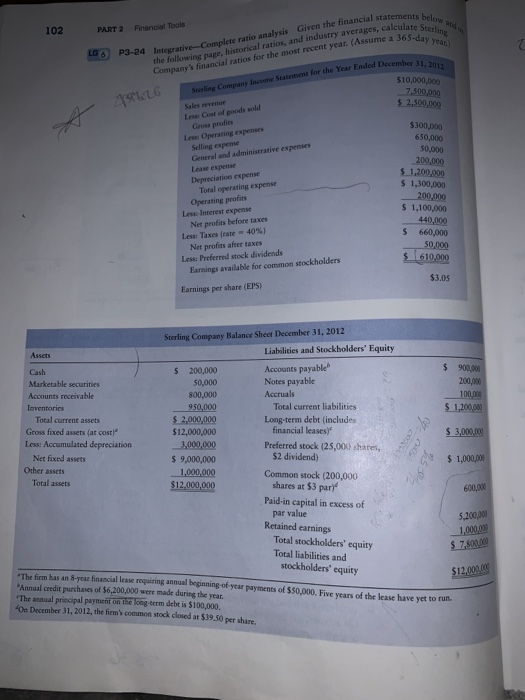
Prepare a common size income statement for Sterling Company and upload it. You may prepare this in excel or manually. 102 PART 2 Pinancial Tools LO P3-24 Integrative Complete ratio analysis Given the financial statements below and on the following page, historical ratios, and industry averages, calculate Sterling Company financial ratios for the most recent year. (Assume a 365 day year) Sacoling Company locome statement for the Year Ended December 31, 2012 SIL $10,000,000 700.000 $ 2.500.000 $300,000 650.000 50,000 Sales revenue Les Cost of sold Gross profits Less Operating expenses Selling expense General and administrative s Lease expense Depreciation expense Total operating expense Operating profits Less Interest expense Net profies before taxes Less Taxes (rate-40%) Net profits after taxes Less: Preferred stock dividends Earnings available for common stockholders $ 1.200.000 $ 1,300,000 200.000 $ 1,100,000 440.000 $ 660,000 50,000 5 610,000 $3.05 Earnings per share (EPS) Assets $ 900,000 200,000 100,000 $ 1,200,000 Marketable securities Accounts receivable Inventories Total current assets Gross fixed assets (at cost" Less: Accumulated depreciation Net fixed assets Other assets Total assets $ 3,000,000 Sterling Company Balance Sheet December 31, 2012 Liabilities and Stockholders' Equity $ 200,000 Accounts payable 50.000 Notes payable 800,000 Accronis 950,000 Total current liabilities $ 2,000,000 Long-term debt (includes $12,000,000 financial leases 3,000,000 Preferred stock (25,000 shares, $ 9,000,000 $2 dividend) 1,000,000 Common stock (200,000 $12,000,000 shares at $3 pary" Paid-in capital in excess of par value Retained earnings Total stockholders' equity Total liabilities and stockholders' equity $ 1,000,000 600,000 5,200,000 1,000,000 $ 7,800,000 $12,000,000 The firm has an 8-year financial lease requiring annual beginning of year payments of $50,000. Five years of the lease have yet to run Annual credit purchases of 56,200,000 were made during the year "The annual principal payment on the long term debt is $100,000 40December 31, 2012, the firm's common stock closed at $39.50 per share CHAPTER 3 Financial Statements and Ratio Analysis 103 Analyze its overall financial situation from both a cross-sectional and a time-series viewpoint. Break your analysis into evaluations of the firm's liquidity, activity, debt, profitability, and market. Historical and Industry Average Ratios for Sterling Company Ratio Actual 2011 Industry average, 2012 1.85 1.05 8.60 1.55 0.92 9.21 36.9 days 61.6 days 0.80 0.20 7.3 35.5 days 46.4 days Actuai 2010 1.40 1.09 9.52 45.6 days 59.3 days 0.74 0.20 8.2 4.5 0.30 0.12 0.062 0.045 0.061 $1.75 12.0 1.20 Current ratio Quick ratio Inventory turnover Average collection period Average payment period Total asset turnover Debt ratio Times interest earned ratio Fixed-payment coverage ratio Gross profit margin Operating profit margin Net profit margin Return on total assets (ROA) Return on common equity (ROE) Earnings per share (EPS) Price/earnings (P/E) ratio Market/book (M/B) ratio 4.2 0.27 0.12 0.062 0.050 0.067 $2.20 10.5 1.05 0.74 0.30 8.0 4.2 0.25 0.10 0.053 0.040 0.066 $1.50 11.2 1.10 25 DuPont system of analysis Use the following ratio information for Johnson International and the industry averages for Johnson's line of business to: a. Construct the DuPont system of analysis for both Johnson and the industry. b. Evaluate Johnson (and the industry) over the 3-year period. Indicate in which areas Iohnson requires further analysis Yhur? 102 PART 2 Financial Tools eylate Sterling 365-day yet 0 h 31, 2012 P3-24 Interative Complete ratio analysis Given the financial statements the following pape, historical ratios, and industry averages, calculat Company's financial ratios for the most recent year. (Assume a 365 Serie Company Income Statement for the Year Ended December $10,000,000 7.500.000 $ 2.500,00 ALLE Sales Le Coed goods sold Le Operating expenses Selling expense General and administrative expenses Lease expense Depreciation expense Total operating expense Operating profits Lasse Interest expense Net profits before taxes Less: Taxes (rate -40%) Net profits after taxes Les Preferred stock dividends Famnings available for common stockholders $300,000 650,000 50.000 200,000 $ 1,200,000 $1.300.000 200,000 $ 1,100,000 440,000 $ 660,000 50,000 $ 610.000 $3.05 Earnings per share (EPS) Assets Cash Marketable securities Accounts receivable Inventories Total current assets Gross fixed assets (at cost" Less: Accumulated depreciation Net fixed assets Other assets Total assets Sterling Company Balance Sheet December 31, 2012 Liabilities and Stockholders' Equity $ 200,000 Accounts payable 50,000 Notes payable 800,000 Accruals 950,000 Total current liabilities $ 2,000,000 Long-term debt (includes $12,000,000 financial leases 3,000,000 Preferred stock (25,000 shares, $ 9,000,000 $2 dividend) 1.000.000 Common stock (200,000 $12,000,000 shares at $3 pary $ 900,00 200.000 100.00 $ 1.200.000 $ 3,000.00 $ 1,000,000 600,000 Paid-in capital in excess of par value Retained earnings Total stockholders' equity Total liabilities and stockholders' equity 5,200,000 1,000.00 $ 7.000 $12.000 The bus in year financial lease m a nual beginning of year payments of $50,000. Five years of the lease have yet to run Annual credit purchases of 56,200,000 were made during the year "The annual principal payment on the long-term debt is $100,000 40 Desember 31, 2012, the firm's common stock closed at $39.50 shume
Step by Step Solution
There are 3 Steps involved in it

Get step-by-step solutions from verified subject matter experts