

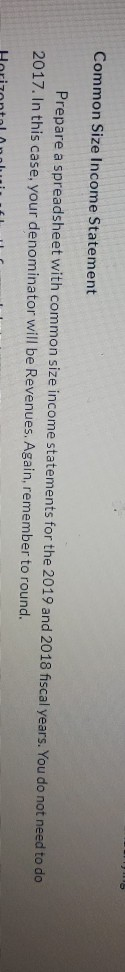
Question: common size income statement Prepare a spreadsheet with common size income statements for 2019 and 2018 fiscal years. You do not need to do 2017.
common size income statement Prepare a spreadsheet with common size income statements for 2019 and 2018 fiscal years. You do not need to do 2017. please prepare the income statement nothing else
can you solve these ratios instead using the data I provided
I provided revenue in the income statement and I will provide the balance sheet and statement of cash flow i provided all the data I have i don't have any data you should work from this because I provided it all
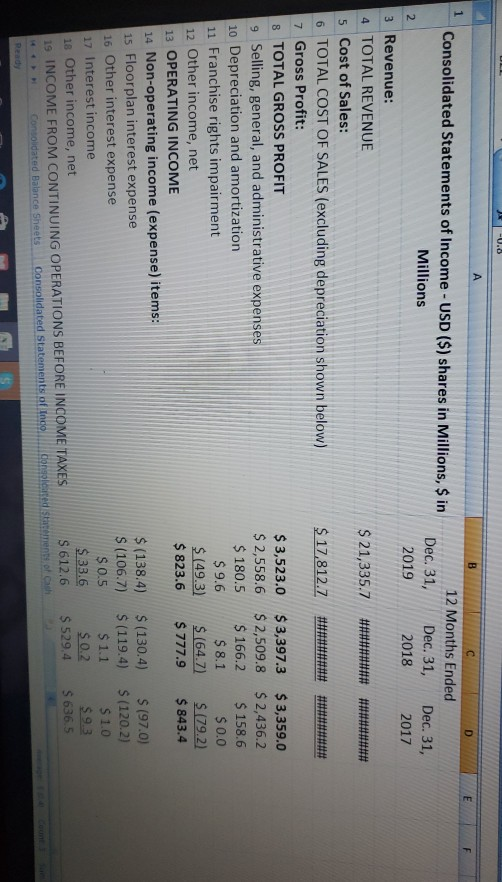
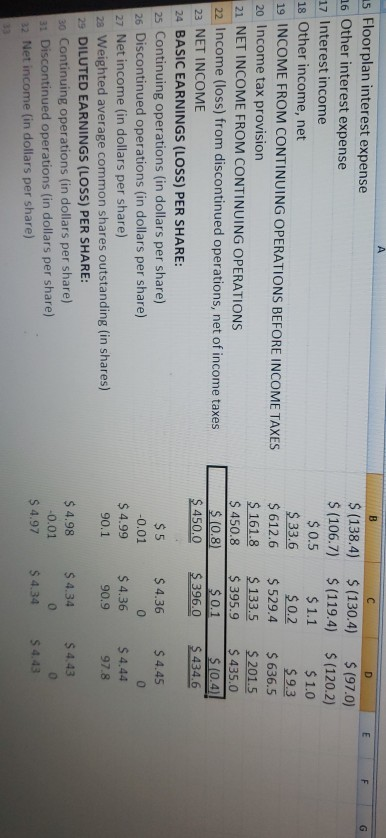
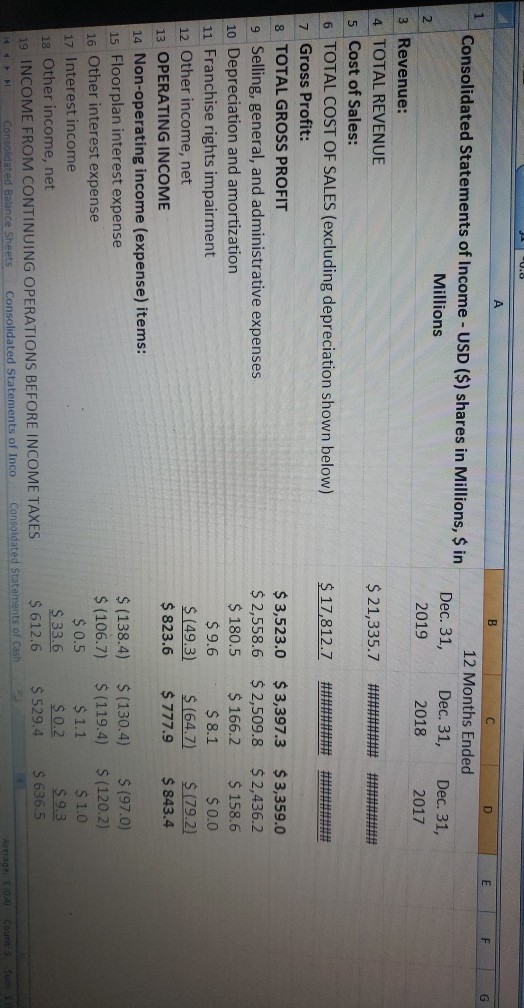
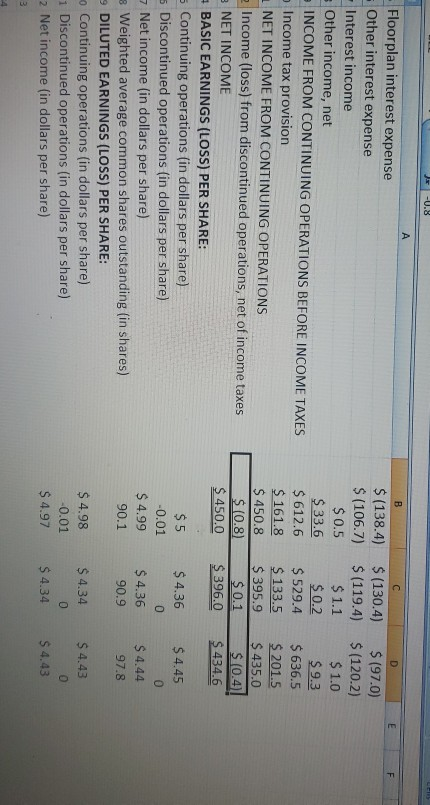
the question is to prepare a common size income statement i provided the income statement below
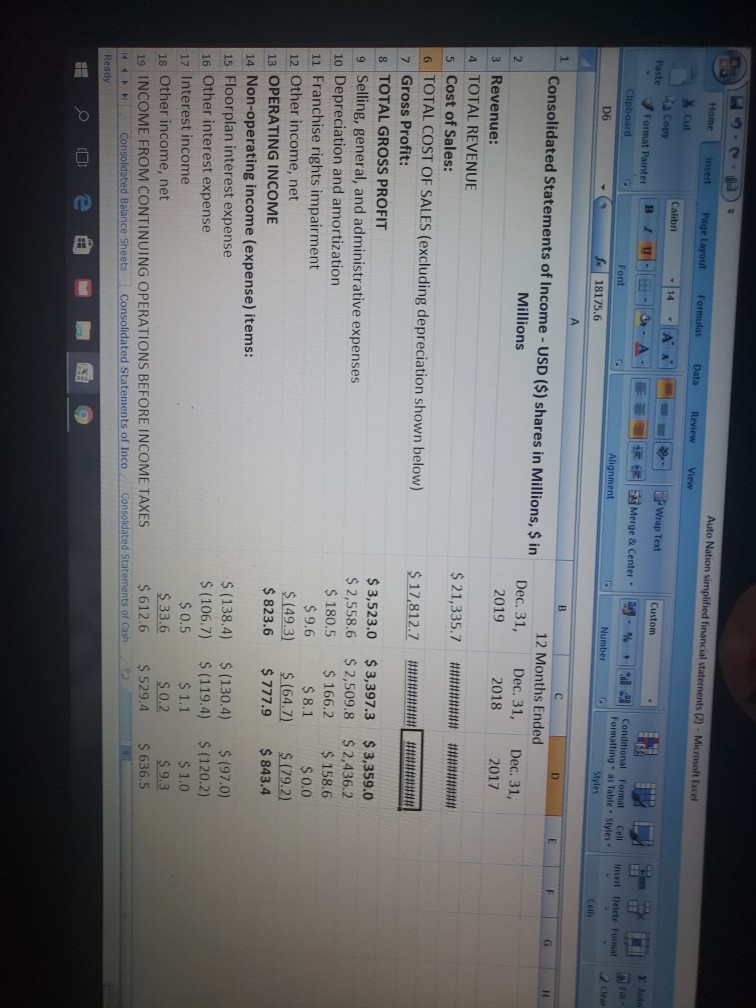
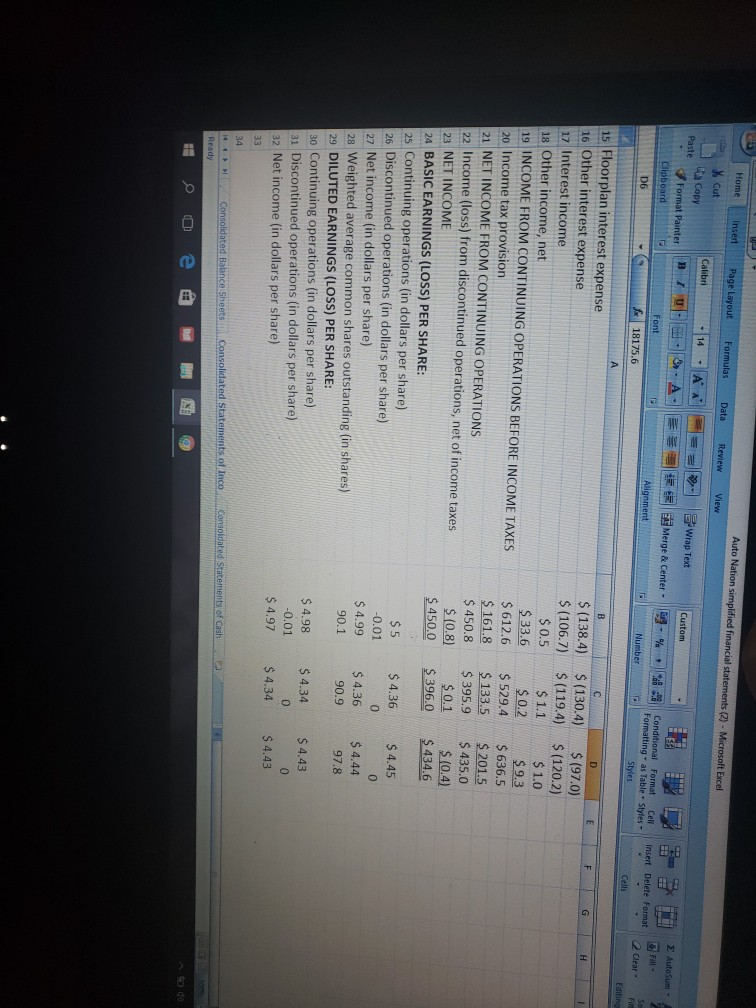
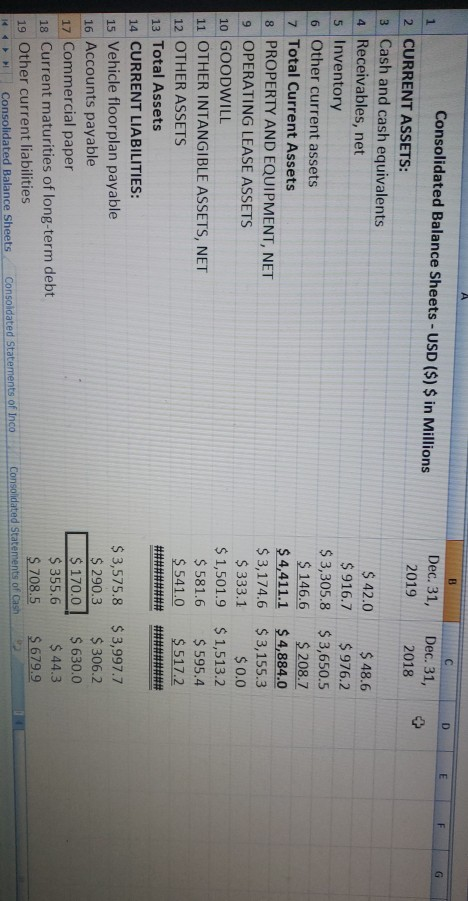
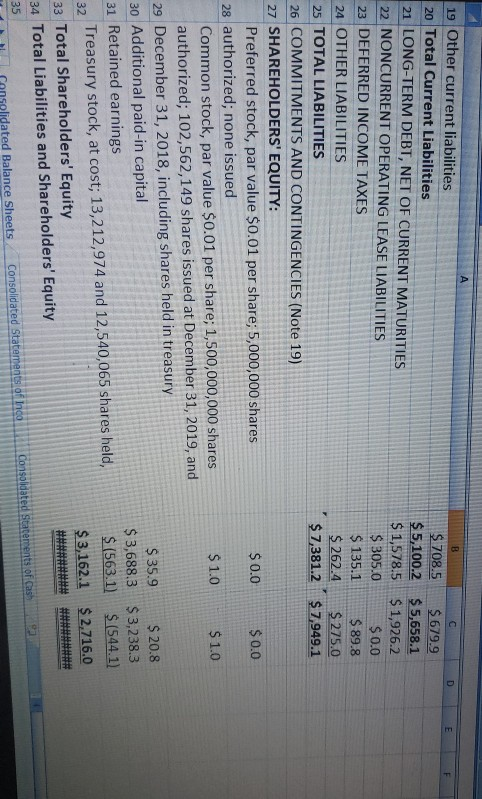
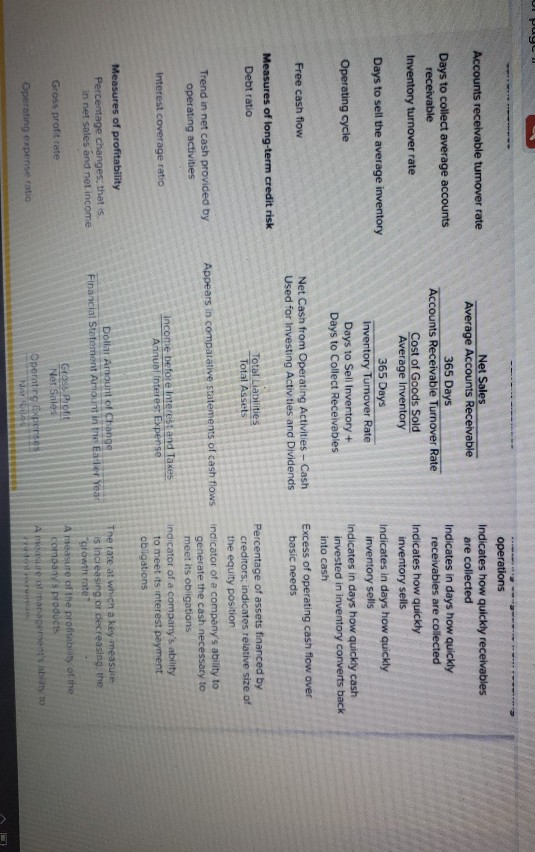
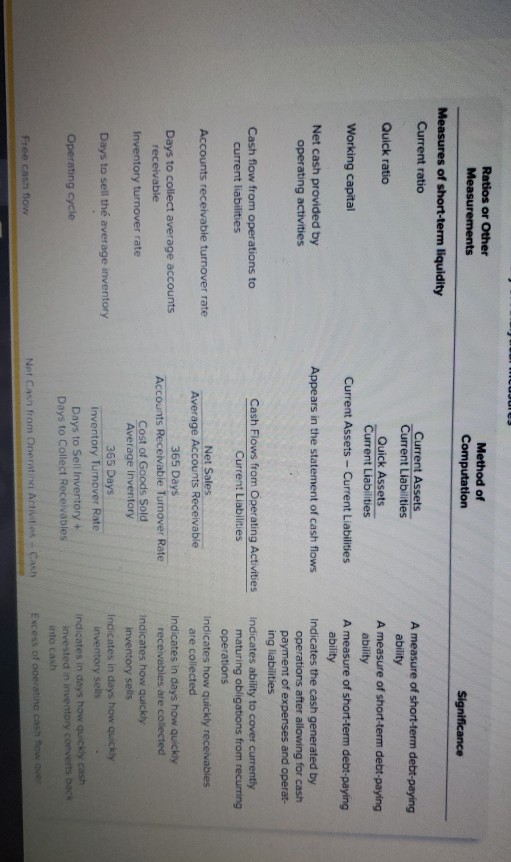
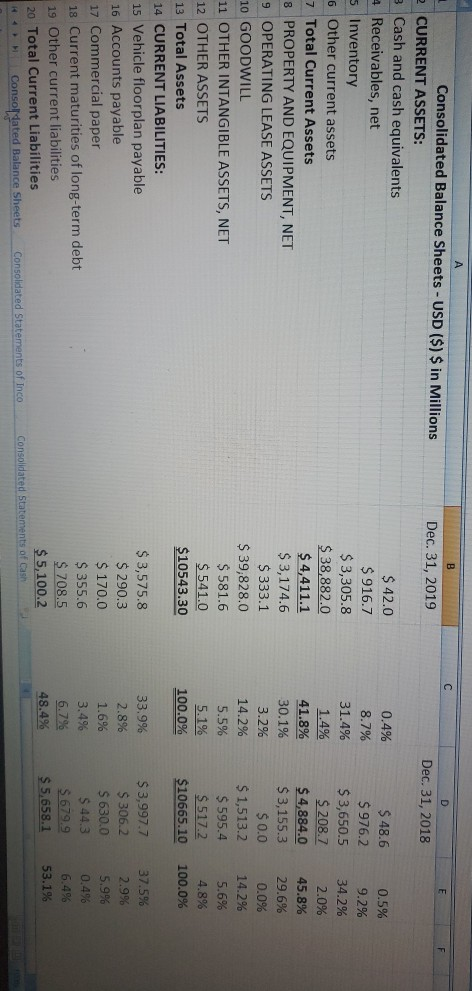
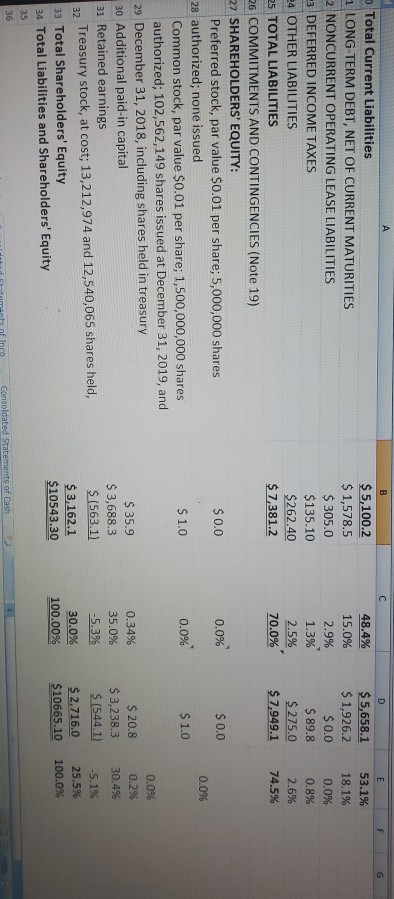
A B Consolidated Balance Sheets - USD ($) $ in Millions D E F G 1 Dec. 31, 2019 Dec. 31, 2018 2 CURRENT ASSETS: 3 Cash and cash equivalents 4 Receivables, net 5 Inventory 6 Other current assets 7 Total Current Assets 8 PROPERTY AND EQUIPMENT, NET 9 OPERATING LEASE ASSETS 10 GOODWILL 11 OTHER INTANGIBLE ASSETS, NET 12 OTHER ASSETS 13 Total Assets 14 CURRENT LIABILITIES: 15 Vehicle floorplan payable 16 Accounts payable 17 Commercial paper 18 Current maturities of long-term debt 19 Other current liabilities Consolidated Balance Sheets Consoldated Statements of Inco $ 42.0 $48.6 $ 916.7 $976.2 $3,305.8 $3,650.5 $ 146.6 $ 208.7 $ 4,411.1 $ 4,884.0 $ 3,174.6 $3,155.3 $333.1 $ 0.0 $ 1,501.9 $ 1,513.2 $ 581.6 $ 595.4 $ 541.0 $ 517.2 $ 3,575.8 $ 3,997.7 $ 290.3 $ 306.2 $ 170.0 $ 630.0 $ 355.6 $ 44.3 $ 708.5 $ 679.9 Consolidated Statements of Cash D F 19 Other current liabilities 20 Total Current Liabilities $ 708.5 $ 679.9 21 LONG-TERM DEBT, NET OF CURRENT MATURITIES $5,100.2 $ 5,658.1 22 NONCURRENT OPERATING LEASE LIABILITIES $ 1,578.5 $ 1,926.2 23 DEFERRED INCOME TAXES $ 305.0 $ 0.0 $ 135.1 $ 89.8 24 OTHER LIABILITIES $ 262.4 $ 275.0 25 TOTAL LIABILITIES $7,381.2 $ 7,949.1 26 COMMITMENTS AND CONTINGENCIES (Note 19) 27 SHAREHOLDERS' EQUITY: Preferred stock, par value $0.01 per share; 5,000,000 shares $ 0.0 $ 0.0 28 authorized; none issued Common stock, par value $0.01 per share; 1,500,000,000 shares $ 1.0 $ 1.0 authorized; 102,562,149 shares issued at December 31, 2019, and 29 December 31, 2018, including shares held in treasury $ 35.9 $ 20.8 30 Additional paid-in capital $ 3,688.3 $3,238.3 31 Retained earnings $ (563.1) $ (544.1) Treasury stock, at cost; 13,212,974 and 12,540,065 shares held, 32 $ 3,162.1 $2.716.0 33 Total Shareholders' Equity 34 Total Liabilities and Shareholders' Equity Consolidated Statements of Cash solidated Balance Sheets Consolidated Statements of Inco 35 Pugell Accounts receivable tumover rate Days to collect average accounts receivable Inventory turnover rate Net Sales Average Accounts Receivable 365 Days Accounts Receivable Turnover Rate Cost of Goods Sold Average Inventory 365 Days Inventory Turnover Rate Days to Sell Inventory + Days to Collect Receivables operations Indicates how quickly receivables are collected Indicates in days how quickly receivables are collected Indicates how quickly inventory sells Indicates in days how quickly inventory sells Indicates in days how quickly cash invested in inventory converts back into cash Excess of operating cash flow over basic needs Days to sell the average inventory Operating cycle Free cash flow Net Cash from Operating Activities - Cash Used for Investing Activities and Dividends Measures of long-term credit risk Debt ratio Total Liabilities Total Assets Appears in comparative statements of cash flows Trend in net cash provided by operating activities Percentage of assets financed by creditors: indicates relative size of the equity position Indicator of a company's ability to generate the cash necessary to meet its obligations Indicator of a company's ability to meet its interest payment obligations Interest coverage ratio Income before Interest and Takes Annual Interest Expense Measures of profitability Percentage changes that is in net sales and net income Doll Amount of Change Financial Statement Amount in the Eater Year The rate at which a key measure is increasing or decreasing the towth rate A measure of the profitability of the coman's products Attenpement's abluty to Gross profit rate GEOSS Piot Net Sales Operating expenses NA SO Operating expense ratio Ratios or Other Measurements Method of Computation Significance Measures of short-term liquidity Current ratio Quick ratio Current Assets Current Liabilities Quick Assets Current Liabilities Current Assets - Current Liabilities Working capital Net cash provided by operating activities Appears in the statement of cash flows Cash flow from operations to current liabilities Cash Flows from Operating Activities Current Liabilities A measure of short-term debt-paying ability A measure of short-term debt-paying ability A measure of short-term debt-paying ability Indicates the cash generated by operations after allowing for cash payment of expenses and operat- ing liabilities Indicates ability to cover currently maturing obligations from recurring operations indicates how quickly receivables are collected Indicates in days how quickly receivables are collected Indicates how quickly inventory sells Indicates in days how quickly inventory sells indicates in days how quickly cash invested in inventory converts a into cash Excess of operating how Accounts receivable turnover rate Days to collect average accounts receivable Inventory turnover rate Net Sales Average Accounts Receivable 365 Days Accounts Receivable Turnover Rate Cost of Goods Sold Average Inventory 365 Days Inventory Turnover Rate Days to Sell Inventory+ Days to Collect Receivables Days to sell the average inventory Operating cycle Free cash flow Net Cash from Operating Artivities - Cash -0.0 B F F D 1 Consolidated Statements of Income - USD ($) shares in Millions, $ in 12 Months Ended Millions Dec. 31, Dec. 31, Dec. 31, 2 2019 2018 2017 3 Revenue: 4 TOTAL REVENUE $ 21,335.7 ############ 5 Cost of Sales: 6 TOTAL COST OF SALES (excluding depreciation shown below) $ 17,812.7 7 Gross Profit: 8 TOTAL GROSS PROFIT $ 3,523.0 $ 3,397.3 $3,359.0 9 Selling, general, and administrative expenses $ 2,558.6 $2,509.8 $2,436.2 10 Depreciation and amortization $ 180.5 $ 166.2 $ 158.6 11 Franchise rights impairment $ 9.6 $ 8.1 $ 0.0 12 Other income, net $(49.3) $ (64.7) $ 179.2) $ 823.6 13 OPERATING INCOME $ 777.9 $ 843.4 14 Non-operating income (expense) items: $(138.4) $(130.4) S (97.0) 15 Floorplan interest expense 16 Other interest expense S (106.7) $(119.4) S (120.2) $ 0.5 $ 1.1 $ 1.0 17 Interest income $ 33.6 $0.2 $ 9.3 18 Other income, net S 612.6 $ 529.4 $ 636.5 19 INCOME FROM CONTINUING OPERATIONS BEFORE INCOME TAXES Consolicited Statement of Cash Consolidated Statements of Indo Consolidated Balance Sheets Ready E F G 15 Floorplan interest expense 26 Other interest expense 17 Interest income 18 Other income, net 19 INCOME FROM CONTINUING OPERATIONS BEFORE INCOME TAXES 20 Income tax provision 21 NET INCOME FROM CONTINUING OPERATIONS 22 Income (loss) from discontinued operations, net of income taxes 23 NET INCOME 24 BASIC EARNINGS (LOSS) PER SHARE: 25 Continuing operations (in dollars per share) 26 Discontinued operations (in dollars per share) 27 Net income (in dollars per share) 22 Weighted average common shares outstanding (in shares) 29 DILUTED EARNINGS (LOSS) PER SHARE: 30 Continuing operations (in dollars per share) 31 Discontinued operations (in dollars per share) 32 Net income (in dollars per share) B $ (138.4) $ (106.7) $ 0.5 $ 33.6 $ 612.6 $ 161.8 $ 450.8 $ (0.8) $ 450.0 $ (130.4) $ (97.0) $(119.4) S (120.2) $ 1.1 $ 1.0 $0.2 $ 9.3 $ 529.4 $ 636.5 $ 133.5 $201.5 $395.9 $ 435.0 $ 0.1 $ (0.4) $ 396.0 $ 434.6 $ 4.45 $5 -0.01 $ 4.99 90.1 $ 4.36 0 $ 4.36 90.9 $ 4.44 97.8 $ 4.34 $ 4.98 -0.01 $ 4.97 $ 4.43 0 $ 4.43 $ 4.34 Common Size Income Statement Prepare a spreadsheet with common size income statements for the 2019 and 2018 fiscal years. You do not need to do 2017. In this case, your denominator will be Revenues. Again, remember to round. "0.8 F F G B D Consolidated Statements of Income - USD ($) shares in Millions, $ in 12 Months Ended Millions Dec. 31, Dec. 31, Dec. 31, 2 2019 2018 2017 3 Revenue: 4 TOTAL REVENUE $ 21,335.7 5 Cost of Sales: 6 TOTAL COST OF SALES (excluding depreciation shown below) $ 17,812.7 7 Gross Profit: 8 TOTAL GROSS PROFIT $ 3,523.0 $ 3,397.3 $ 3,359.0 9 Selling, general, and administrative expenses $ 2,558.6 $ 2,509.8 $ 2,436.2 10 Depreciation and amortization $ 180.5 $ 166.2 $ 158.6 11 Franchise rights impairment $ 9.6 $ 8.1 $ 0.0 12 Other income, net $ (49.3) $ (64.7) $ (79.2) 13 OPERATING INCOME $ 823.6 $ 777.9 $ 843.4 14 Non-operating income (expense) items: 15 Floorplan interest expense $ (138.4) $ (130.4) S (97.0) 16 Other interest expense $ (106.7) $ (119.4) $ (120.2) $ 0.5 17 Interest income $ 1.1 $ 1.0 $ 33.6 $ 0.2 $ 9.3 18 Other income, net $ 612.6 $ 529.4 S 6365 19 INCOME FROM CONTINUING OPERATIONS BEFORE INCOME TAXES Consolidated Balance Sheets Consolidated Statements of Inco Consolidated Statements of Cash -0.8 B F $ (138.4) $ (106.7) $ 0.5 $ 33.6 $ 612.6 $ 161.8 $ 450.8 $ (0.8) $ 450.0 Floorplan interest expense Other interest expense Interest income Other income, net INCOME FROM CONTINUING OPERATIONS BEFORE INCOME TAXES Income tax provision NET INCOME FROM CONTINUING OPERATIONS Income (loss) from discontinued operations, net of income taxes 3 NET INCOME BASIC EARNINGS (LOSS) PER SHARE: Continuing operations (in dollars per share) Discontinued operations (in dollars per share) Net income (in dollars per share) 3 Weighted average common shares outstanding (in shares) DILUTED EARNINGS (LOSS) PER SHARE: Continuing operations (in dollars per share) 1 Discontinued operations (in dollars per share) 2 Net income (in dollars per share) 3 $ (130.4) $ (97.0) $ (119.4) S(120.2) $ 1.1 $ 1.0 $ 0.2 $ 9.3 $ 529.4 $ 636.5 $ 133.5 $201.5 $395.9 $ 435.0 $ 0.1 $ (0.4) $ 396.0 $ 434.6 $ 5 -0.01 $ 4.99 90.1 $ 4.36 0 $ 4.36 90.9 $ 4.45 0 $ 4.44 97.8 $4.98 -0.01 $ 4.97 $ 4.34 0 $4.34 $ 4.43 0 $ 4.43 E D Dec 31, 2018 B Consolidated Balance Sheets - USD ($) $ in Millions Dec. 31, 2019 CURRENT ASSETS: 3 Cash and cash equivalents $ 42.0 4 Receivables, net $ 916.7 5 Inventory $ 3,305.8 6 Other current assets $ 38,882.0 7 Total Current Assets $ 4,411.1 8 PROPERTY AND EQUIPMENT, NET $ 3,174.6 9 OPERATING LEASE ASSETS $ 333.1 10 GOODWILL $ 39,828.0 11 OTHER INTANGIBLE ASSETS, NET $ 581.6 12 OTHER ASSETS $ 541.0 13 Total Assets $10543.30 14 CURRENT LIABILITIES: 15 Vehicle floorplan payable $ 3,575.8 16 Accounts payable $ 290.3 17 Commercial paper $ 170.0 $ 355.6 18 Current maturities of long-term debt 19 Other current liabilities $ 708.5 20 Total Current Liabilities $5,100.2 Consoldated Balance Sheets Consolidated Statements of Inco Consolidated Statements of Cash 0.4% 8.7% 31.4% 1.4% 41.8% 30.1% 3.2% 14.2% 5.5% 5.1% 100.0% $ 48.6 $ 976.2 $ 3,650.5 $ 208.7 $ 4,884.0 $ 3,155.3 $ 0.0 $ 1,513.2 $ 595.4 $ 517.2 $10665.10 0.5% 9.2% 34.2% 2.0% 45.8% 29.6% 0.0% 14.2% 5.6% 4.8% 100.0% 33.9% 2.8% 1.6% 3.4% 6.7% 48.4% $ 3,997.7 $ 306.2 $ 630.0 $ 44.3 $ 679.9 $ 5,658.1 37.5% 2.9% 5.9% 0.4% 6.4% 53.1% C F 48.4% 15.0% 2.9% 53.1% 18.1% $ 5,100.2 $ 1,578.5 $ 305.0 $135.10 $262.40 $7,381.2 $ 5,658.1 $ 1,926.2 $ 0.0 $ 89.8 $275.0 $ 7,949.1 1.3% 2.5% 70.0% 0.0% 0.8% 2.6% 74.5% $ 0.0 0.0% $ 0.0 Total Current Liabilities 1 LONG-TERM DEBT, NET OF CURRENT MATURITIES 2 NONCURRENT OPERATING LEASE LIABILITIES 3 DEFERRED INCOME TAXES 24 OTHER LIABILITIES 25 TOTAL LIABILITIES 26 COMMITMENTS AND CONTINGENCIES (Note 19) 27 SHAREHOLDERS' EQUITY: Preferred stock, par value $0.01 per share; 5,000,000 shares 28 authorized; none issued Common stock, par value $0.01 per share; 1,500,000,000 shares authorized; 102,562,149 shares issued at December 31, 2019, and 29 December 31, 2018, including shares held in treasury 30 Additional paid-in capital 31 Retained earnings 32 Treasury stock, at cost; 13,212,974 and 12,540,065 shares held, 33 Total Shareholders' Equity 34 Total Liabilities and Shareholders' Equity 0.0% $ 1.0 0.0% $ 1.0 0.096 0.296 30.498 $35.9 $ 3,688.3 $ (563.1) $ 3,162.1 $10543.30 0.34% 35.0% -5.3% $ 20.8 $3,238.3 $(544.1 $2.716.0 $10665.10 30.0% 100.00% -5.1% 25.5% 100.0% 35 36 Consoldated Statements of Cash JU DU SITUWh as 5.4%. These numbers on the financial dler Unded to the nearest million, so it is a bit silly to show calculations with more precision than the underlying data. Common Size Income Statement Prepare a spreadsheet with common size income statements for the 2019 and 2018 fiscal years. You do not need to do 2017. In this case, your denominator will be Revenues. Again, remember to round. H Home Page Layout Auto Nation simplified financial statements (2) - Microsoft Excel Formulas Data Review View Calibri 1 AA Paste Wrap Text Cut 3 Copy Format Painter Clipboard D6 Custom BIU-- A- Aut Merge & Center Font la Conditional Format Cell Formatting as Table Styles Styles Insert Delete Format Alignment f 18175.6 Number 2. Clear Cell A H 6 1 B c D Consolidated Statements of Income - USD ($) shares in Millions, $ in 12 Months Ended Millions Dec. 31, Dec. 31, 2 Dec. 31, 3 Revenue: 2019 2018 2017 4 TOTAL REVENUE $ 21,335.7 5 Cost of Sales: TOTAL COST OF SALES (excluding depreciation shown below) $ 17,812.7 7 Gross Profit: 8 TOTAL GROSS PROFIT $ 3,523.0 $ 3,397.3 $ 3,359.0 9 Selling, general, and administrative expenses $ 2,558.6 $2,509.8 $ 2,436.2 10 Depreciation and amortization $ 180.5 $ 166.2 $ 158.6 11 Franchise rights impairment $ 9.6 $ 8.1 $ 0.0 12 Other income, net $ (49.3) $ (64.7) $ 179.2) 13 OPERATING INCOME $ 823.6 $ 777.9 $ 843.4 14 Non-operating income (expense) items: 15 Floorplan interest expense S (138.4) $(130.4) $ (97.0) 16 Other interest expense $ (106.7) $ (119.4) $ (120.2) 17 Interest income $ 0.5 $ 1.1 $ 1.0 18 Other income, net $ 33.6 $ 0.2 $ 9.3 19 INCOME FROM CONTINUING OPERATIONS BEFORE INCOME TAXES $ 612.6 $ 529.4 $ 636.5 Consolidated Balance Sheets Consolidated Statements of Inco Consolidated Statements of Cash Ready Page Layout Formulas Auto Nation simplified financial statements (2) - Microsoft Excel Data Review View Calibri - 14 Home Insert Cut La Copy Paste Format Painter Clipboard D6 - A EWrap Text BTU Custom Merge & Center , AutoSu Font 1. % Alignment Insert Delete Format fx 18175.6 Conditional Format Cell Formatting - as Table Styles Styles Number G Clear Cells Editing B E G 15 Floorplan interest expense 16 Other interest expense 17 Interest income 18 Other income, net 19 INCOME FROM CONTINUING OPERATIONS BEFORE INCOME TAXES 20 Income tax provision 21 NET INCOME FROM CONTINUING OPERATIONS 22 Income (loss) from discontinued operations, net of income taxes 23 NET INCOME 24 BASIC EARNINGS (LOSS) PER SHARE: 25 Continuing operations (in dollars per share) 26 Discontinued operations (in dollars per share) 27 Net income (in dollars per share) 28 Weighted average common shares outstanding (in shares) 29 DILUTED EARNINGS (LOSS) PER SHARE: 30 Continuing operations (in dollars per share) 31 Discontinued operations (in dollars per share) 32 Net income (in dollars per share) D $ (138.4) $(130.4) $ (97.0) $(106.7) $(119.4) S(120.2) $ 0.5 $ 1.1 $ 1.0 $33.6 $ 0.2 $9.3 $ 612.6 $ 529.4 $ 636.5 $ 161.8 $ 133.5 $201.5 $ 450.8 $ 395.9 $ 435.0 $ (0.8) S (0.4) $ 450,0 $ 396.0 $ 434.6 $ 0.1 $ 5 -0.01 $ 4.99 90.1 $ 4.36 0 $ 4.36 90.9 $ 4.45 0 $ 4.44 97.8 $ 4.98 -0.01 $4.97 $ 4.34 0 $ 4.34 $ 4.43 0 $ 4.43 33 34 Consolidated Balance Sheets Consolidated Statements of Inco Consoldated Statements of Cash Ready IF o A B Consolidated Balance Sheets - USD ($) $ in Millions D E F G 1 Dec. 31, 2019 Dec. 31, 2018 2 CURRENT ASSETS: 3 Cash and cash equivalents 4 Receivables, net 5 Inventory 6 Other current assets 7 Total Current Assets 8 PROPERTY AND EQUIPMENT, NET 9 OPERATING LEASE ASSETS 10 GOODWILL 11 OTHER INTANGIBLE ASSETS, NET 12 OTHER ASSETS 13 Total Assets 14 CURRENT LIABILITIES: 15 Vehicle floorplan payable 16 Accounts payable 17 Commercial paper 18 Current maturities of long-term debt 19 Other current liabilities Consolidated Balance Sheets Consoldated Statements of Inco $ 42.0 $48.6 $ 916.7 $976.2 $3,305.8 $3,650.5 $ 146.6 $ 208.7 $ 4,411.1 $ 4,884.0 $ 3,174.6 $3,155.3 $333.1 $ 0.0 $ 1,501.9 $ 1,513.2 $ 581.6 $ 595.4 $ 541.0 $ 517.2 $ 3,575.8 $ 3,997.7 $ 290.3 $ 306.2 $ 170.0 $ 630.0 $ 355.6 $ 44.3 $ 708.5 $ 679.9 Consolidated Statements of Cash D F 19 Other current liabilities 20 Total Current Liabilities $ 708.5 $ 679.9 21 LONG-TERM DEBT, NET OF CURRENT MATURITIES $5,100.2 $ 5,658.1 22 NONCURRENT OPERATING LEASE LIABILITIES $ 1,578.5 $ 1,926.2 23 DEFERRED INCOME TAXES $ 305.0 $ 0.0 $ 135.1 $ 89.8 24 OTHER LIABILITIES $ 262.4 $ 275.0 25 TOTAL LIABILITIES $7,381.2 $ 7,949.1 26 COMMITMENTS AND CONTINGENCIES (Note 19) 27 SHAREHOLDERS' EQUITY: Preferred stock, par value $0.01 per share; 5,000,000 shares $ 0.0 $ 0.0 28 authorized; none issued Common stock, par value $0.01 per share; 1,500,000,000 shares $ 1.0 $ 1.0 authorized; 102,562,149 shares issued at December 31, 2019, and 29 December 31, 2018, including shares held in treasury $ 35.9 $ 20.8 30 Additional paid-in capital $ 3,688.3 $3,238.3 31 Retained earnings $ (563.1) $ (544.1) Treasury stock, at cost; 13,212,974 and 12,540,065 shares held, 32 $ 3,162.1 $2.716.0 33 Total Shareholders' Equity 34 Total Liabilities and Shareholders' Equity Consolidated Statements of Cash solidated Balance Sheets Consolidated Statements of Inco 35 Pugell Accounts receivable tumover rate Days to collect average accounts receivable Inventory turnover rate Net Sales Average Accounts Receivable 365 Days Accounts Receivable Turnover Rate Cost of Goods Sold Average Inventory 365 Days Inventory Turnover Rate Days to Sell Inventory + Days to Collect Receivables operations Indicates how quickly receivables are collected Indicates in days how quickly receivables are collected Indicates how quickly inventory sells Indicates in days how quickly inventory sells Indicates in days how quickly cash invested in inventory converts back into cash Excess of operating cash flow over basic needs Days to sell the average inventory Operating cycle Free cash flow Net Cash from Operating Activities - Cash Used for Investing Activities and Dividends Measures of long-term credit risk Debt ratio Total Liabilities Total Assets Appears in comparative statements of cash flows Trend in net cash provided by operating activities Percentage of assets financed by creditors: indicates relative size of the equity position Indicator of a company's ability to generate the cash necessary to meet its obligations Indicator of a company's ability to meet its interest payment obligations Interest coverage ratio Income before Interest and Takes Annual Interest Expense Measures of profitability Percentage changes that is in net sales and net income Doll Amount of Change Financial Statement Amount in the Eater Year The rate at which a key measure is increasing or decreasing the towth rate A measure of the profitability of the coman's products Attenpement's abluty to Gross profit rate GEOSS Piot Net Sales Operating expenses NA SO Operating expense ratio Ratios or Other Measurements Method of Computation Significance Measures of short-term liquidity Current ratio Quick ratio Current Assets Current Liabilities Quick Assets Current Liabilities Current Assets - Current Liabilities Working capital Net cash provided by operating activities Appears in the statement of cash flows Cash flow from operations to current liabilities Cash Flows from Operating Activities Current Liabilities A measure of short-term debt-paying ability A measure of short-term debt-paying ability A measure of short-term debt-paying ability Indicates the cash generated by operations after allowing for cash payment of expenses and operat- ing liabilities Indicates ability to cover currently maturing obligations from recurring operations indicates how quickly receivables are collected Indicates in days how quickly receivables are collected Indicates how quickly inventory sells Indicates in days how quickly inventory sells indicates in days how quickly cash invested in inventory converts a into cash Excess of operating how Accounts receivable turnover rate Days to collect average accounts receivable Inventory turnover rate Net Sales Average Accounts Receivable 365 Days Accounts Receivable Turnover Rate Cost of Goods Sold Average Inventory 365 Days Inventory Turnover Rate Days to Sell Inventory+ Days to Collect Receivables Days to sell the average inventory Operating cycle Free cash flow Net Cash from Operating Artivities - Cash -0.0 B F F D 1 Consolidated Statements of Income - USD ($) shares in Millions, $ in 12 Months Ended Millions Dec. 31, Dec. 31, Dec. 31, 2 2019 2018 2017 3 Revenue: 4 TOTAL REVENUE $ 21,335.7 ############ 5 Cost of Sales: 6 TOTAL COST OF SALES (excluding depreciation shown below) $ 17,812.7 7 Gross Profit: 8 TOTAL GROSS PROFIT $ 3,523.0 $ 3,397.3 $3,359.0 9 Selling, general, and administrative expenses $ 2,558.6 $2,509.8 $2,436.2 10 Depreciation and amortization $ 180.5 $ 166.2 $ 158.6 11 Franchise rights impairment $ 9.6 $ 8.1 $ 0.0 12 Other income, net $(49.3) $ (64.7) $ 179.2) $ 823.6 13 OPERATING INCOME $ 777.9 $ 843.4 14 Non-operating income (expense) items: $(138.4) $(130.4) S (97.0) 15 Floorplan interest expense 16 Other interest expense S (106.7) $(119.4) S (120.2) $ 0.5 $ 1.1 $ 1.0 17 Interest income $ 33.6 $0.2 $ 9.3 18 Other income, net S 612.6 $ 529.4 $ 636.5 19 INCOME FROM CONTINUING OPERATIONS BEFORE INCOME TAXES Consolicited Statement of Cash Consolidated Statements of Indo Consolidated Balance Sheets Ready E F G 15 Floorplan interest expense 26 Other interest expense 17 Interest income 18 Other income, net 19 INCOME FROM CONTINUING OPERATIONS BEFORE INCOME TAXES 20 Income tax provision 21 NET INCOME FROM CONTINUING OPERATIONS 22 Income (loss) from discontinued operations, net of income taxes 23 NET INCOME 24 BASIC EARNINGS (LOSS) PER SHARE: 25 Continuing operations (in dollars per share) 26 Discontinued operations (in dollars per share) 27 Net income (in dollars per share) 22 Weighted average common shares outstanding (in shares) 29 DILUTED EARNINGS (LOSS) PER SHARE: 30 Continuing operations (in dollars per share) 31 Discontinued operations (in dollars per share) 32 Net income (in dollars per share) B $ (138.4) $ (106.7) $ 0.5 $ 33.6 $ 612.6 $ 161.8 $ 450.8 $ (0.8) $ 450.0 $ (130.4) $ (97.0) $(119.4) S (120.2) $ 1.1 $ 1.0 $0.2 $ 9.3 $ 529.4 $ 636.5 $ 133.5 $201.5 $395.9 $ 435.0 $ 0.1 $ (0.4) $ 396.0 $ 434.6 $ 4.45 $5 -0.01 $ 4.99 90.1 $ 4.36 0 $ 4.36 90.9 $ 4.44 97.8 $ 4.34 $ 4.98 -0.01 $ 4.97 $ 4.43 0 $ 4.43 $ 4.34 Common Size Income Statement Prepare a spreadsheet with common size income statements for the 2019 and 2018 fiscal years. You do not need to do 2017. In this case, your denominator will be Revenues. Again, remember to round. "0.8 F F G B D Consolidated Statements of Income - USD ($) shares in Millions, $ in 12 Months Ended Millions Dec. 31, Dec. 31, Dec. 31, 2 2019 2018 2017 3 Revenue: 4 TOTAL REVENUE $ 21,335.7 5 Cost of Sales: 6 TOTAL COST OF SALES (excluding depreciation shown below) $ 17,812.7 7 Gross Profit: 8 TOTAL GROSS PROFIT $ 3,523.0 $ 3,397.3 $ 3,359.0 9 Selling, general, and administrative expenses $ 2,558.6 $ 2,509.8 $ 2,436.2 10 Depreciation and amortization $ 180.5 $ 166.2 $ 158.6 11 Franchise rights impairment $ 9.6 $ 8.1 $ 0.0 12 Other income, net $ (49.3) $ (64.7) $ (79.2) 13 OPERATING INCOME $ 823.6 $ 777.9 $ 843.4 14 Non-operating income (expense) items: 15 Floorplan interest expense $ (138.4) $ (130.4) S (97.0) 16 Other interest expense $ (106.7) $ (119.4) $ (120.2) $ 0.5 17 Interest income $ 1.1 $ 1.0 $ 33.6 $ 0.2 $ 9.3 18 Other income, net $ 612.6 $ 529.4 S 6365 19 INCOME FROM CONTINUING OPERATIONS BEFORE INCOME TAXES Consolidated Balance Sheets Consolidated Statements of Inco Consolidated Statements of Cash -0.8 B F $ (138.4) $ (106.7) $ 0.5 $ 33.6 $ 612.6 $ 161.8 $ 450.8 $ (0.8) $ 450.0 Floorplan interest expense Other interest expense Interest income Other income, net INCOME FROM CONTINUING OPERATIONS BEFORE INCOME TAXES Income tax provision NET INCOME FROM CONTINUING OPERATIONS Income (loss) from discontinued operations, net of income taxes 3 NET INCOME BASIC EARNINGS (LOSS) PER SHARE: Continuing operations (in dollars per share) Discontinued operations (in dollars per share) Net income (in dollars per share) 3 Weighted average common shares outstanding (in shares) DILUTED EARNINGS (LOSS) PER SHARE: Continuing operations (in dollars per share) 1 Discontinued operations (in dollars per share) 2 Net income (in dollars per share) 3 $ (130.4) $ (97.0) $ (119.4) S(120.2) $ 1.1 $ 1.0 $ 0.2 $ 9.3 $ 529.4 $ 636.5 $ 133.5 $201.5 $395.9 $ 435.0 $ 0.1 $ (0.4) $ 396.0 $ 434.6 $ 5 -0.01 $ 4.99 90.1 $ 4.36 0 $ 4.36 90.9 $ 4.45 0 $ 4.44 97.8 $4.98 -0.01 $ 4.97 $ 4.34 0 $4.34 $ 4.43 0 $ 4.43 E D Dec 31, 2018 B Consolidated Balance Sheets - USD ($) $ in Millions Dec. 31, 2019 CURRENT ASSETS: 3 Cash and cash equivalents $ 42.0 4 Receivables, net $ 916.7 5 Inventory $ 3,305.8 6 Other current assets $ 38,882.0 7 Total Current Assets $ 4,411.1 8 PROPERTY AND EQUIPMENT, NET $ 3,174.6 9 OPERATING LEASE ASSETS $ 333.1 10 GOODWILL $ 39,828.0 11 OTHER INTANGIBLE ASSETS, NET $ 581.6 12 OTHER ASSETS $ 541.0 13 Total Assets $10543.30 14 CURRENT LIABILITIES: 15 Vehicle floorplan payable $ 3,575.8 16 Accounts payable $ 290.3 17 Commercial paper $ 170.0 $ 355.6 18 Current maturities of long-term debt 19 Other current liabilities $ 708.5 20 Total Current Liabilities $5,100.2 Consoldated Balance Sheets Consolidated Statements of Inco Consolidated Statements of Cash 0.4% 8.7% 31.4% 1.4% 41.8% 30.1% 3.2% 14.2% 5.5% 5.1% 100.0% $ 48.6 $ 976.2 $ 3,650.5 $ 208.7 $ 4,884.0 $ 3,155.3 $ 0.0 $ 1,513.2 $ 595.4 $ 517.2 $10665.10 0.5% 9.2% 34.2% 2.0% 45.8% 29.6% 0.0% 14.2% 5.6% 4.8% 100.0% 33.9% 2.8% 1.6% 3.4% 6.7% 48.4% $ 3,997.7 $ 306.2 $ 630.0 $ 44.3 $ 679.9 $ 5,658.1 37.5% 2.9% 5.9% 0.4% 6.4% 53.1% C F 48.4% 15.0% 2.9% 53.1% 18.1% $ 5,100.2 $ 1,578.5 $ 305.0 $135.10 $262.40 $7,381.2 $ 5,658.1 $ 1,926.2 $ 0.0 $ 89.8 $275.0 $ 7,949.1 1.3% 2.5% 70.0% 0.0% 0.8% 2.6% 74.5% $ 0.0 0.0% $ 0.0 Total Current Liabilities 1 LONG-TERM DEBT, NET OF CURRENT MATURITIES 2 NONCURRENT OPERATING LEASE LIABILITIES 3 DEFERRED INCOME TAXES 24 OTHER LIABILITIES 25 TOTAL LIABILITIES 26 COMMITMENTS AND CONTINGENCIES (Note 19) 27 SHAREHOLDERS' EQUITY: Preferred stock, par value $0.01 per share; 5,000,000 shares 28 authorized; none issued Common stock, par value $0.01 per share; 1,500,000,000 shares authorized; 102,562,149 shares issued at December 31, 2019, and 29 December 31, 2018, including shares held in treasury 30 Additional paid-in capital 31 Retained earnings 32 Treasury stock, at cost; 13,212,974 and 12,540,065 shares held, 33 Total Shareholders' Equity 34 Total Liabilities and Shareholders' Equity 0.0% $ 1.0 0.0% $ 1.0 0.096 0.296 30.498 $35.9 $ 3,688.3 $ (563.1) $ 3,162.1 $10543.30 0.34% 35.0% -5.3% $ 20.8 $3,238.3 $(544.1 $2.716.0 $10665.10 30.0% 100.00% -5.1% 25.5% 100.0% 35 36 Consoldated Statements of Cash JU DU SITUWh as 5.4%. These numbers on the financial dler Unded to the nearest million, so it is a bit silly to show calculations with more precision than the underlying data. Common Size Income Statement Prepare a spreadsheet with common size income statements for the 2019 and 2018 fiscal years. You do not need to do 2017. In this case, your denominator will be Revenues. Again, remember to round. H Home Page Layout Auto Nation simplified financial statements (2) - Microsoft Excel Formulas Data Review View Calibri 1 AA Paste Wrap Text Cut 3 Copy Format Painter Clipboard D6 Custom BIU-- A- Aut Merge & Center Font la Conditional Format Cell Formatting as Table Styles Styles Insert Delete Format Alignment f 18175.6 Number 2. Clear Cell A H 6 1 B c D Consolidated Statements of Income - USD ($) shares in Millions, $ in 12 Months Ended Millions Dec. 31, Dec. 31, 2 Dec. 31, 3 Revenue: 2019 2018 2017 4 TOTAL REVENUE $ 21,335.7 5 Cost of Sales: TOTAL COST OF SALES (excluding depreciation shown below) $ 17,812.7 7 Gross Profit: 8 TOTAL GROSS PROFIT $ 3,523.0 $ 3,397.3 $ 3,359.0 9 Selling, general, and administrative expenses $ 2,558.6 $2,509.8 $ 2,436.2 10 Depreciation and amortization $ 180.5 $ 166.2 $ 158.6 11 Franchise rights impairment $ 9.6 $ 8.1 $ 0.0 12 Other income, net $ (49.3) $ (64.7) $ 179.2) 13 OPERATING INCOME $ 823.6 $ 777.9 $ 843.4 14 Non-operating income (expense) items: 15 Floorplan interest expense S (138.4) $(130.4) $ (97.0) 16 Other interest expense $ (106.7) $ (119.4) $ (120.2) 17 Interest income $ 0.5 $ 1.1 $ 1.0 18 Other income, net $ 33.6 $ 0.2 $ 9.3 19 INCOME FROM CONTINUING OPERATIONS BEFORE INCOME TAXES $ 612.6 $ 529.4 $ 636.5 Consolidated Balance Sheets Consolidated Statements of Inco Consolidated Statements of Cash Ready Page Layout Formulas Auto Nation simplified financial statements (2) - Microsoft Excel Data Review View Calibri - 14 Home Insert Cut La Copy Paste Format Painter Clipboard D6 - A EWrap Text BTU Custom Merge & Center , AutoSu Font 1. % Alignment Insert Delete Format fx 18175.6 Conditional Format Cell Formatting - as Table Styles Styles Number G Clear Cells Editing B E G 15 Floorplan interest expense 16 Other interest expense 17 Interest income 18 Other income, net 19 INCOME FROM CONTINUING OPERATIONS BEFORE INCOME TAXES 20 Income tax provision 21 NET INCOME FROM CONTINUING OPERATIONS 22 Income (loss) from discontinued operations, net of income taxes 23 NET INCOME 24 BASIC EARNINGS (LOSS) PER SHARE: 25 Continuing operations (in dollars per share) 26 Discontinued operations (in dollars per share) 27 Net income (in dollars per share) 28 Weighted average common shares outstanding (in shares) 29 DILUTED EARNINGS (LOSS) PER SHARE: 30 Continuing operations (in dollars per share) 31 Discontinued operations (in dollars per share) 32 Net income (in dollars per share) D $ (138.4) $(130.4) $ (97.0) $(106.7) $(119.4) S(120.2) $ 0.5 $ 1.1 $ 1.0 $33.6 $ 0.2 $9.3 $ 612.6 $ 529.4 $ 636.5 $ 161.8 $ 133.5 $201.5 $ 450.8 $ 395.9 $ 435.0 $ (0.8) S (0.4) $ 450,0 $ 396.0 $ 434.6 $ 0.1 $ 5 -0.01 $ 4.99 90.1 $ 4.36 0 $ 4.36 90.9 $ 4.45 0 $ 4.44 97.8 $ 4.98 -0.01 $4.97 $ 4.34 0 $ 4.34 $ 4.43 0 $ 4.43 33 34 Consolidated Balance Sheets Consolidated Statements of Inco Consoldated Statements of Cash Ready IF o
Step by Step Solution
There are 3 Steps involved in it

Get step-by-step solutions from verified subject matter experts