

Question: All the information that was provided. Not sure what else is needed! Selected financial data of two competitors, Target and Wal-Mart, are presented here. (All
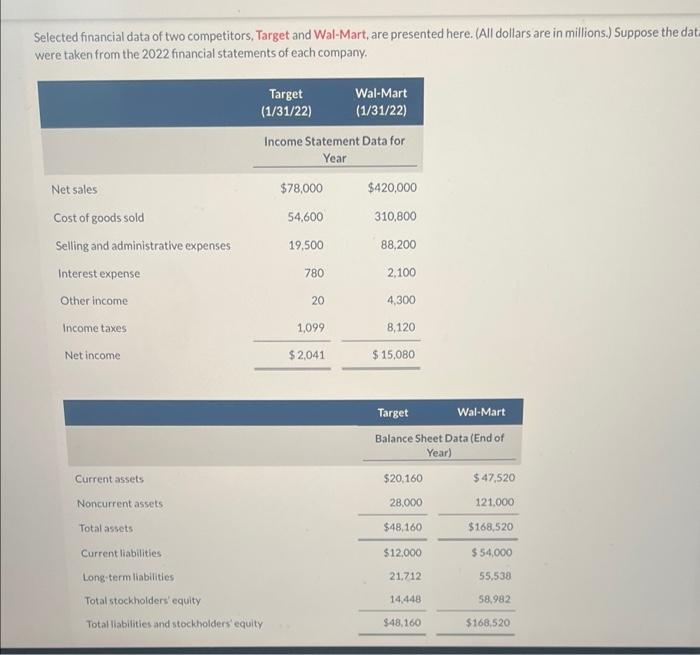
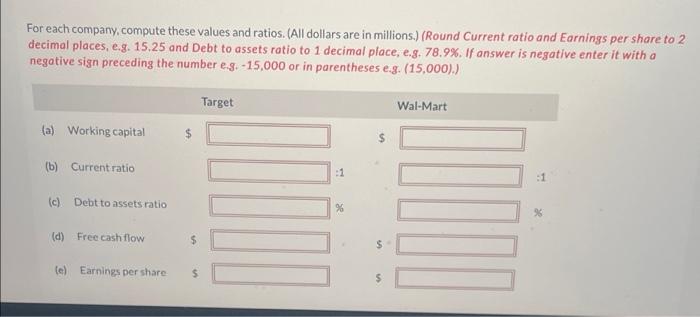
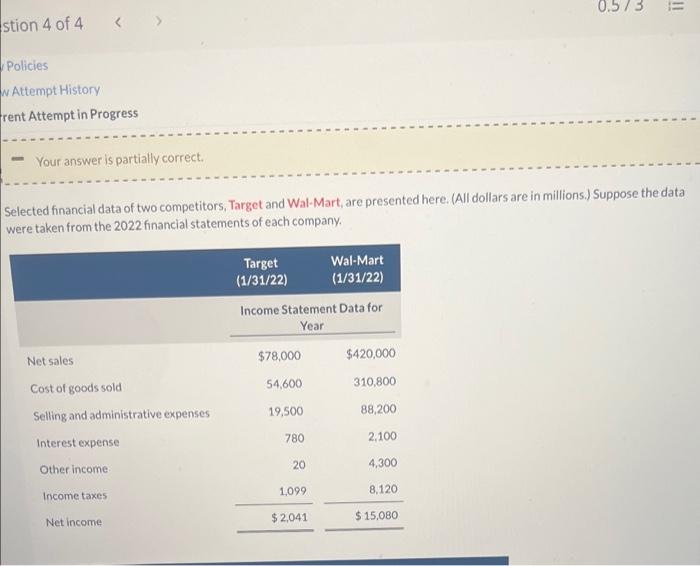
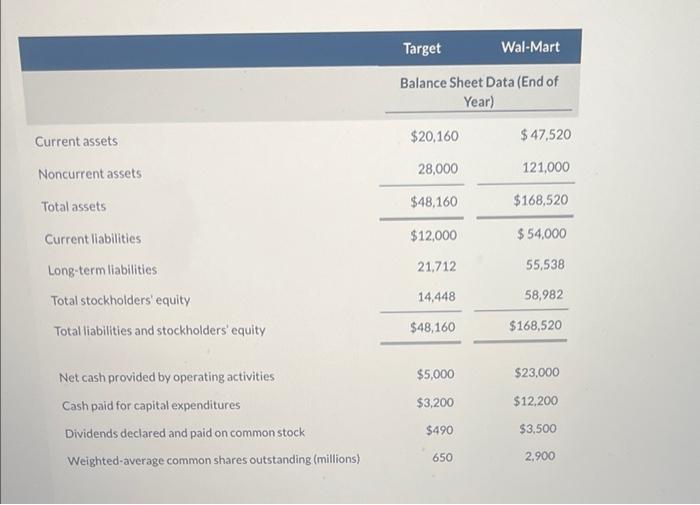
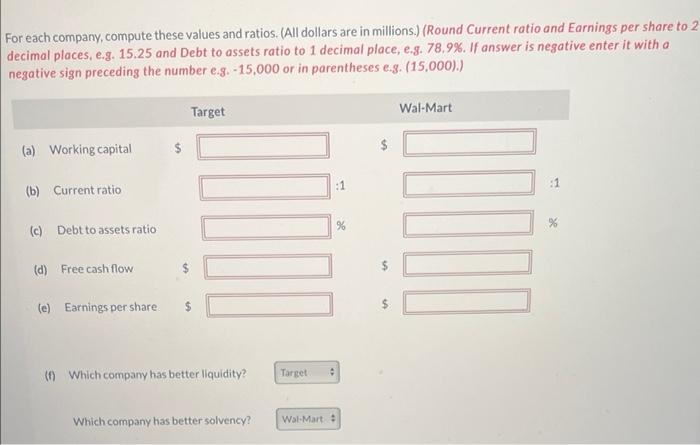
Selected financial data of two competitors, Target and Wal-Mart, are presented here. (All dollars are in millions.) Suppose the dat. were taken from the 2022 financial statements of each company. Target (1/31/22) Wal-Mart (1/31/22) Income Statement Data for Year Net sales $78,000 $420,000 Cost of goods sold 54,600 310,800 Selling and administrative expenses 19,500 88,200 Interest expense 780 2,100 Other income 20 4,300 Income taxes 1,099 8,120 Net income $2,041 $ 15,080 Target Wal-Mart Balance Sheet Data (End of Year) $20,160 $47,520 28,000 121.000 $48,160 $168,520 $12,000 $ 54,000 21,712 55,538 14,448 58,982 $48,160 $168,520 Current assets Noncurrent assets Total assets Current liabilities Long-term liabilities Total stockholders' equity Total liabilities and stockholders' equity For each company, compute these values and ratios. (All dollars are in millions.) (Round Current ratio and Earnings per share to 2 decimal places, e.g. 15.25 and Debt to assets ratio to 1 decimal place, e.g. 78.9 %. If answer is negative enter it with a negative sign preceding the number e.g. -15,000 or in parentheses e.g. (15,000).) Target Wal-Mart (a) Working capital (b) Current ratio :1 :1 (c) Debt to assets ratio % (d) Free cash flow (e) Earnings per share $ $ 11 stion 4 of 4 Policies w Attempt History rent Attempt in Progress 0.573 Your answer is partially correct. Selected financial data of two competitors, Target and Wal-Mart, are presented here. (All dollars are in millions.) Suppose the data were taken from the 2022 financial statements of each company. Target Wal-Mart (1/31/22) (1/31/22) Income Statement Data for Year Net sales $78,000 $420,000 Cost of goods sold 54,600 310,800 Selling and administrative expenses 19,500 88,200 Interest expense 780 2,100 Other income 20 4,300 Income taxes 1,099 8,120 Net income $2,041 $15,080 Current assets Noncurrent assets Total assets Current liabilities Long-term liabilities Total stockholders' equity Total liabilities and stockholders' equity Net cash provided by operating activities Cash paid for capital expenditures Dividends declared and paid on common stock Weighted-average common shares outstanding (millions) Target Wal-Mart Balance Sheet Data (End of Year) $20,160 $ 47,520 28,000 121,000 $48,160 $168,520 $12,000 $ 54,000 21,712 55,538 14,448 58,982 $48,160 $168,520 $5,000 $23,000 $3,200 $12,200 $490 $3,500 650 2,900 For each company, compute these values and ratios. (All dollars are in millions.) (Round Current ratio and Earnings per share to 2 decimal places, e.g. 15.25 and Debt to assets ratio to 1 decimal place, e.g. 78.9%. If answer is negative enter it with a negative sign preceding the number e.g. -15,000 or in parentheses e.g. (15,000).) Target Wal-Mart (a) Working capital (b) Current ratio (c) Debt to assets ratio (d) Free cash flow (e) Earnings per share. (f) Which company has better liquidity? Which company has better solvency? 10000 Target Wal-Mart 0
Step by Step Solution
There are 3 Steps involved in it

Get step-by-step solutions from verified subject matter experts