

Question: all years 010 B D G 2000 2001 2002 2003 2004 2005 on 3 4 5 6 Sales 7 Cost of goods sold 8 Gross
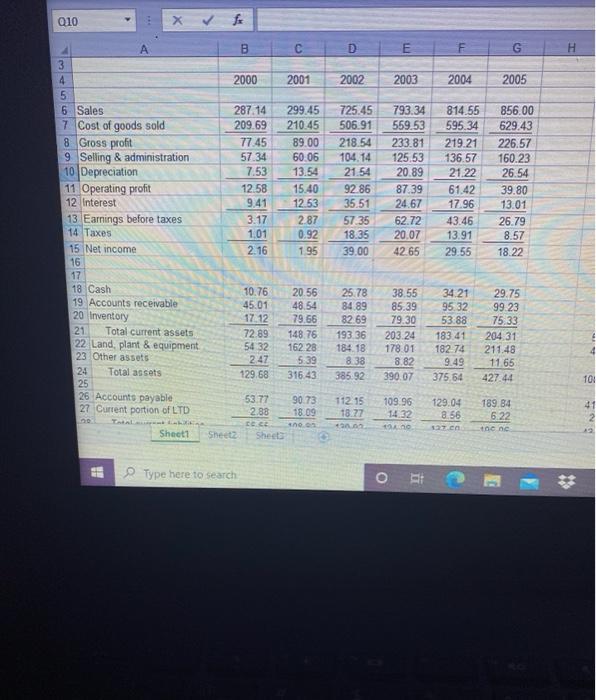
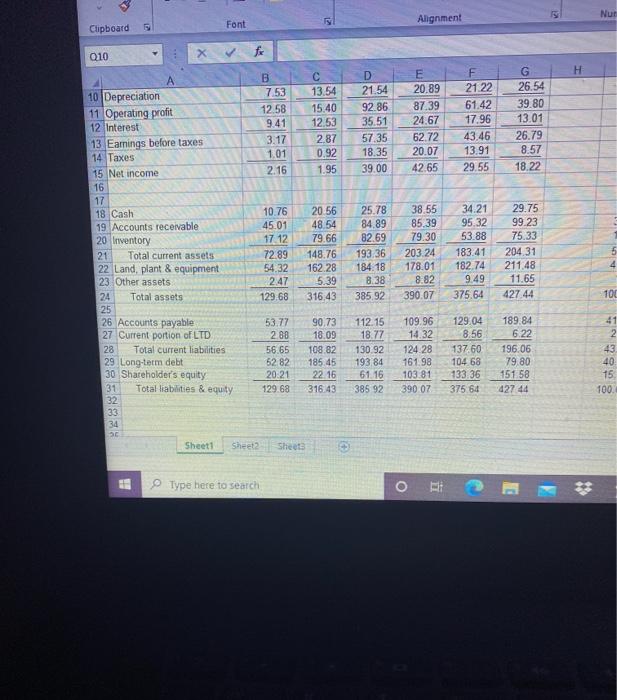

010 B D G 2000 2001 2002 2003 2004 2005 on 3 4 5 6 Sales 7 Cost of goods sold 8 Gross profit 9 Selling & administration 10 Depreciation 11 Operating profit 12 Interest 13 Earnings before taxes 14 Taxes 15 Net income 16 17 18 Cash 19 Accounts receivable 20 Inventory 21 Total current assets 22 Land plant & equipment 23 Other assets 24 Total assets 25 26 Accounts payable 27 Current portion of LTD 00 Sheet1 287.14 209.69 77.45 57.34 7.53 12.58 9.41 3.17 1.01 2.16 299.45 210.45 89.00 60.06 13.54 15.40 12.53 2.87 0.92 1.95 725.45 506.91 218.54 104.14 21.54 92.86 35.51 57 35 18.35 39.00 793.34 559.53 233.81 125.53 20.89 87.39 24.67 62.72 20.07 42.65 814.55 595.34 219.21 136.57 21.22 61.42 17.96 43.46 13.91 29.55 856.00 629.43 226.57 160.23 26.54 39.80 13.01 26.79 8.57 18.22 10.76 45.01 17.12 72.89 54 32 2 47 129.68 20.56 48.54 79.66 148 76 162.28 5:39 316.43 25.78 84 89 82 69 19336 184.18 8.38 385.92 38.55 85.39 79.30 203.24 178 01 8.82 390 07 34 21 95 32 53.88 183.41 18274 9.49 375 54 29.75 99.23 75.33 204 31 211.48 11.65 42744 10 53.77 2.88 CE Sheet 90 73 18.09 *10 112.15 18.77 109.96 14.32 129.04 8.56 189.84 6.22 10e ne Type here to search * Nur Font Alignment Clipboard 6 010 H D 21.54 92.86 35.51 57.35 18.35 39.00 E 20.89 87.39 24.67 62.72 20.07 42.65 21.22 61.42 17.96 43,46 13.91 29.55 G 26.54 39.80 13.01 26.79 8.57 18.22 0.92 A B 10 Depreciation 7.53 13.54 11 Operating profit 12.58 15.40 12 Interest 9.41 12.53 3.17 2.87 13. Earnings before taxes 14 Taxes 1.01 15 Net income 2.16 1.95 16 17 18 Cash 10.76 20 56 19 Accounts receivable 45.01 48.54 20 Inventory 17 12 79.66 21 Total current assets 72.89 148.76 22 Land, plant & equipment 54.32 162 28 23 Other assets 2.47 5.39 24 Total assets 129 68 316,43 25 26 Accounts payable 53.77 90.73 27 Current portion of LTD 2.88 18.09 28 Total current liabilities 56 65 108 82 29. Long-term debt 52 82 185.45 30 Shareholder's equity 20:21 22 16 31 Total liabilities & equity 129.68 316.43 32 33 34 Sheet1 Sheet2 Sheet 25.78 84.89 82.69 193 36 184.18 8.38 385.92 38.55 85.39 79.30 203.24 178.01 8.82 390.07 34.21 95:32 53.88 183.41 182.74 9.49 375.64 29.75 99.23 75.33 204 31 211.48 11.65 427 44 th 4 100 41 2 112.15 18.77 130 92 193 84 61.16 385 92 109.96 14.32 124 28 161.98 103.81 390 07 129.04 8.56 137.60 104 68 133.36 375 64 189.84 6.22 196.06 79.80 151 58 427 44 43 40 15 100. Type here to search O Excel needs to contain the common-sized balance sheet and income statement, the statemen of cash flow, and the financial ratios in "A basic set of financial ratios
Step by Step Solution
There are 3 Steps involved in it

Get step-by-step solutions from verified subject matter experts