

Question: Along with the sensitivity analysis, Anusha is including a scenario analysis for the project in her report, giving the probability of the project generating
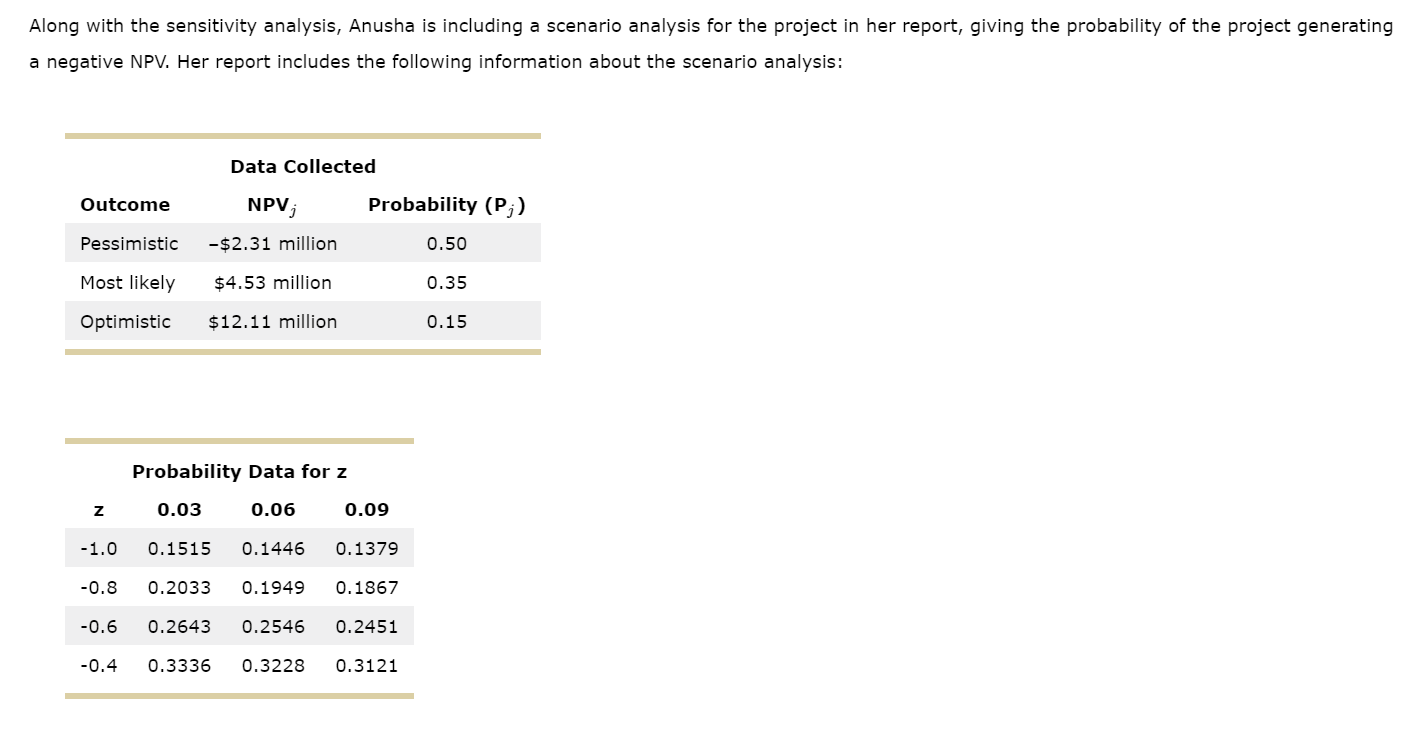
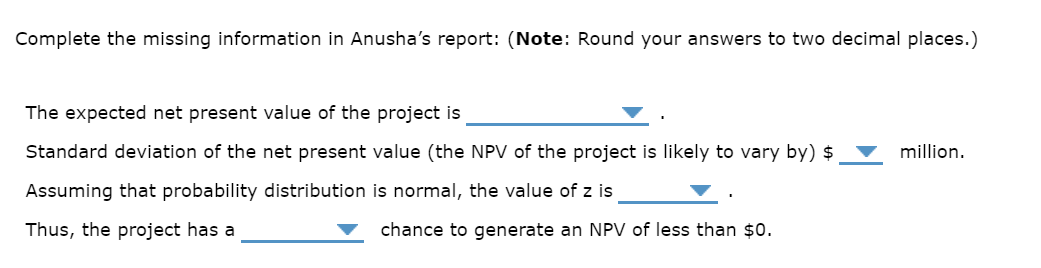
Along with the sensitivity analysis, Anusha is including a scenario analysis for the project in her report, giving the probability of the project generating a negative NPV. Her report includes the following information about the scenario analysis: Outcome Pessimistic Most likely Optimistic Data Collected NPV; Z -$2.31 million $4.53 million $12.11 million Probability (P) Probability Data for z 0.03 0.06 0.09 -1.0 0.1515 0.1446 0.1379 -0.8 0.2033 0.1949 0.1867 -0.6 0.2643 0.2546 0.2451 -0.4 0.3336 0.3228 0.3121 0.50 0.35 0.15 Complete the missing information in Anusha's report: (Note: Round your answers to two decimal places.) The expected net present value of the project is Standard deviation of the net present value (the NPV of the project is likely to vary by) $ Assuming that probability distribution is normal, the value of z is Thus, the project has a chance to generate an NPV of less than $0. million.
Step by Step Solution
There are 3 Steps involved in it
To complete the missing information in Anushas report we need to calculate the expected net present ... View full answer

Get step-by-step solutions from verified subject matter experts