

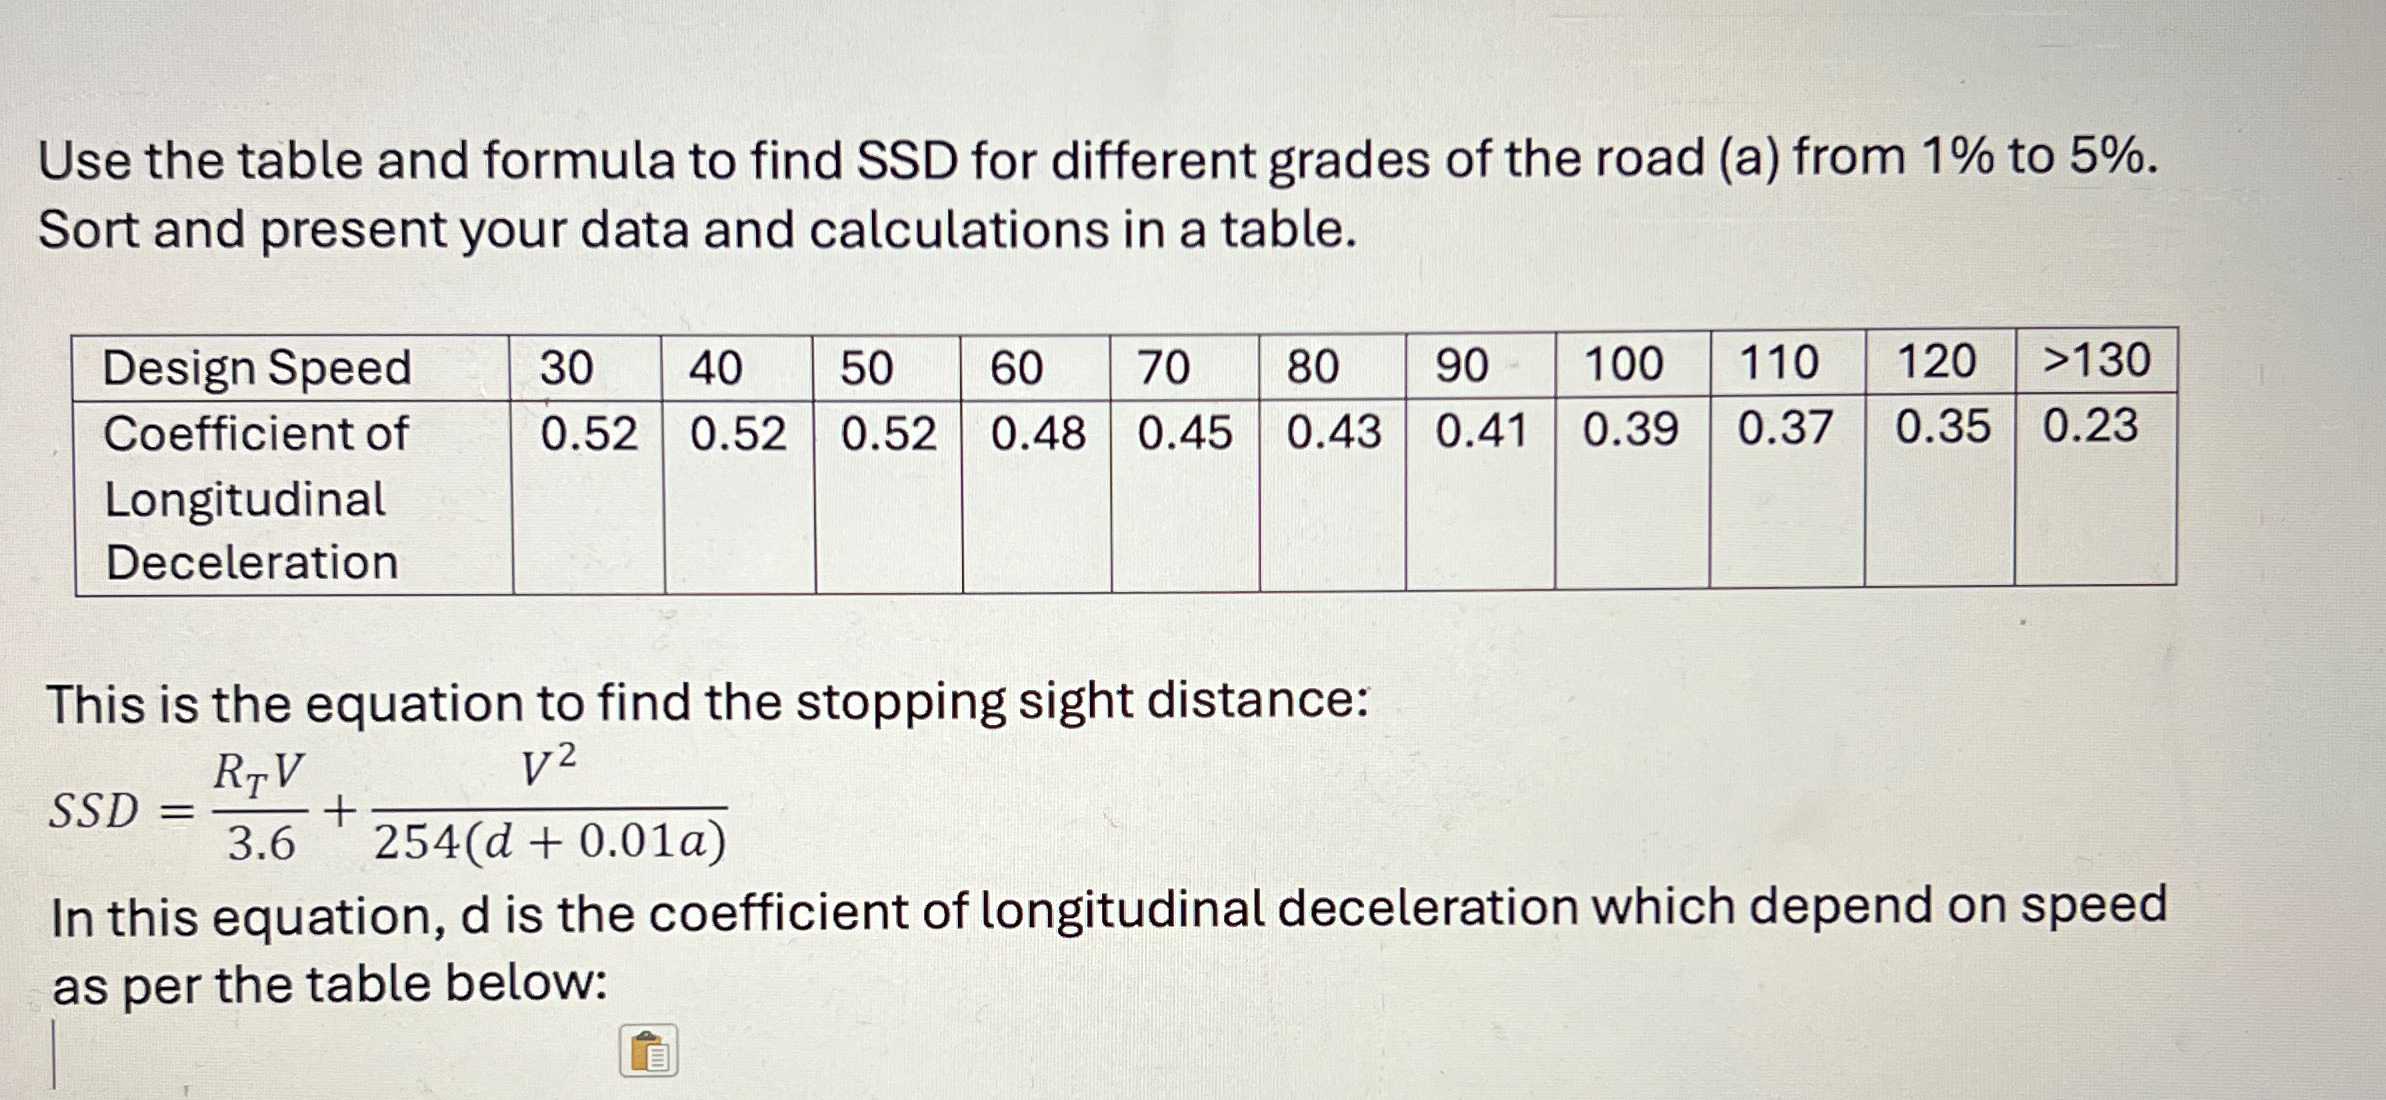
Question: Also draw a graph to show 5 lines for SSD from 1 % to 5 % . Each line should show the relation between V
Also draw a graph to show lines for SSD from to Each line should show the relation between V on Xaxis and SSD on Yaxis.
Step by Step Solution
There are 3 Steps involved in it
1 Expert Approved Answer
Step: 1 Unlock

Question Has Been Solved by an Expert!
Get step-by-step solutions from verified subject matter experts
Step: 2 Unlock
Step: 3 Unlock