Question: also find the p-value for both question please i will like if the answer is right. a 12 10 13 16 17 18 19 20
also find the p-value for both question please i will like if the answer is right.
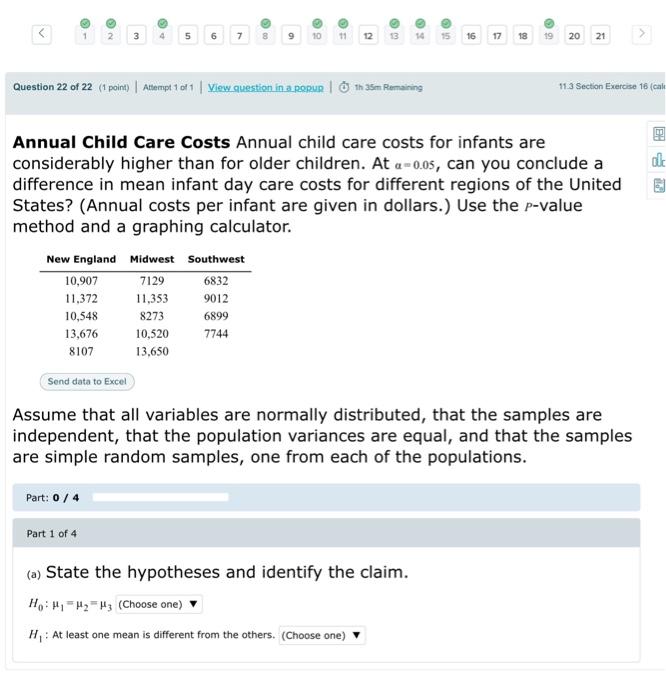

a 12 10 13 16 17 18 19 20 21 Question 22 of 22 (1 point) | Atempt 1 011 | View question in a popur I h 25m Remaining 11.3 Section Exercise 18 (cale Annual Child Care Costs Annual child care costs for infants are considerably higher than for older children. At a = 0.05, can you conclude a difference in mean infant day care costs for different regions of the United States? (Annual costs per infant are given in dollars.) Use the p-value method and a graphing calculator. New England Midwest Southwest 10,907 7129 6832 11,372 11,353 9012 10,548 8273 6899 13,676 10,520 7744 8107 13.650 Send data to Excel Assume that all variables are normally distributed, that the samples are independent, that the population variances are equal, and that the samples are simple random samples, one from each of the populations. Part: 0 / 4 Part 1 of 4 (a) State the hypotheses and identify the claim. H:H, H2 H3 (Choose one) H: At least one mean is different from the others. Choose one) 1 7 12 16 17 18 19 20 21 Question 21 of 22 (1 point) Antempt 1 of 1 | View question in a conur 1h 35m Remaining 11.1 Section Exercise 12 (calc) Ages of Head Start Program Students The Head Start Program provides a wide range of services to low-income children up to the age of s and their do families. Its goals are to provide services to improve social and learning skills and to improve health and nutrition status so that the participants can begin school on an equal footing with their more advantaged peers. The distribution of ages for participating children is as follows: 4% five-year- olds, 52% four-year-olds, 34% three-year-olds, and 10% under three years. When the program was assessed in a particular region, it was found that of the 200 participants, 11 were 5 years old, 94 were 4 years old, 83 were 3 years old, and 12 were under 3 years. Is there sufficient evidence at a=0.0s that the proportions differ from that of the program? Use the P-value method. Use TI-83 Plus/TI-84 Plus calculator. Part: 0/4 Part 1 of 4 (a) Identify the claim with the correct hypothesis. Ho: The distribution of ages for children participating in the Head Start Program is as follows: 4% five-year- olds, 52% four-year-olds, 34% three-year-olds, and 10% under three years. Choose one) H,: The distribution is not the same as stated in the null hypothesis. (Choose one)


