

Question: Also generate the following plots from your Matlab program: i. The linear fit plot from the scale readings similar to Figure E2.3(b) (page 21) The
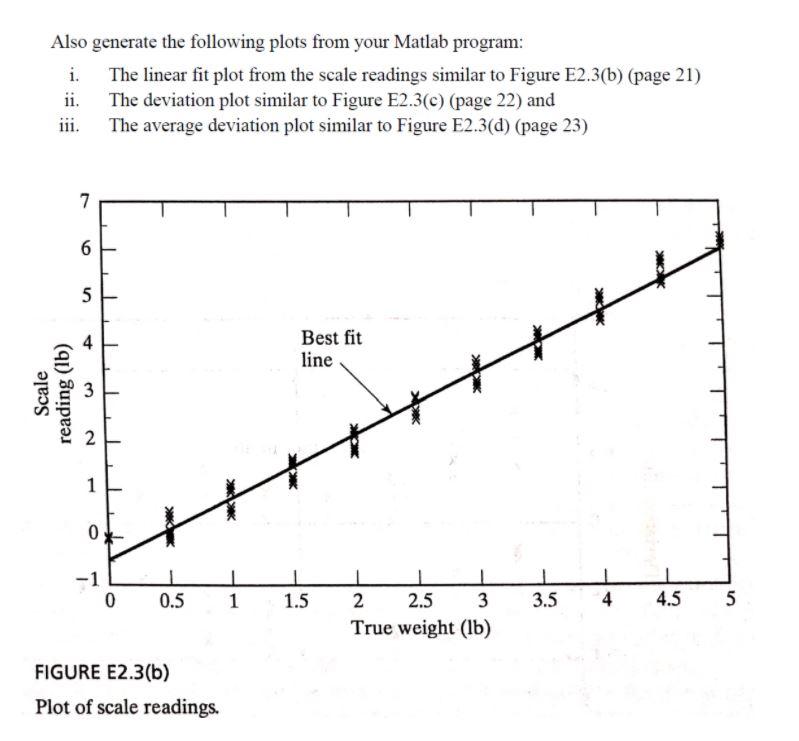
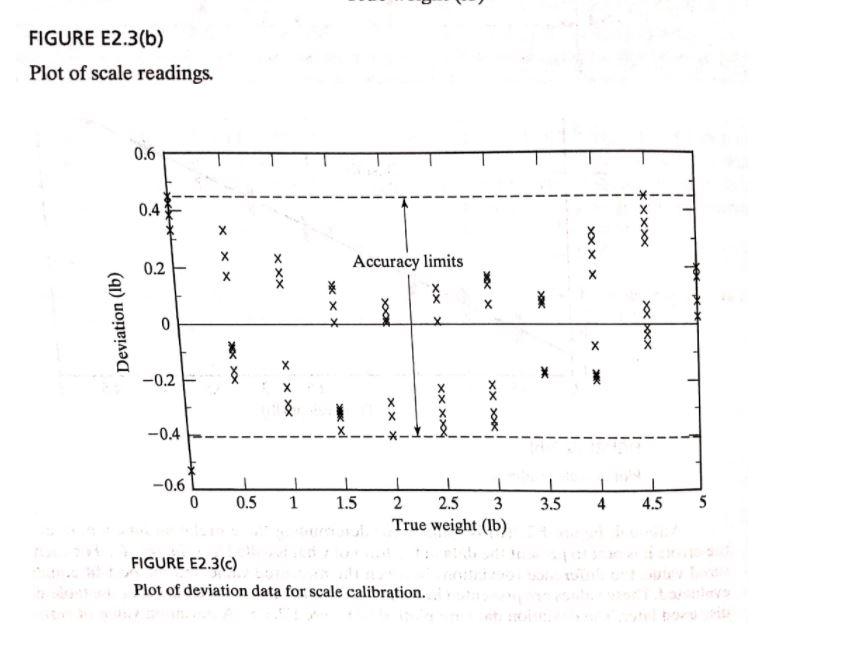
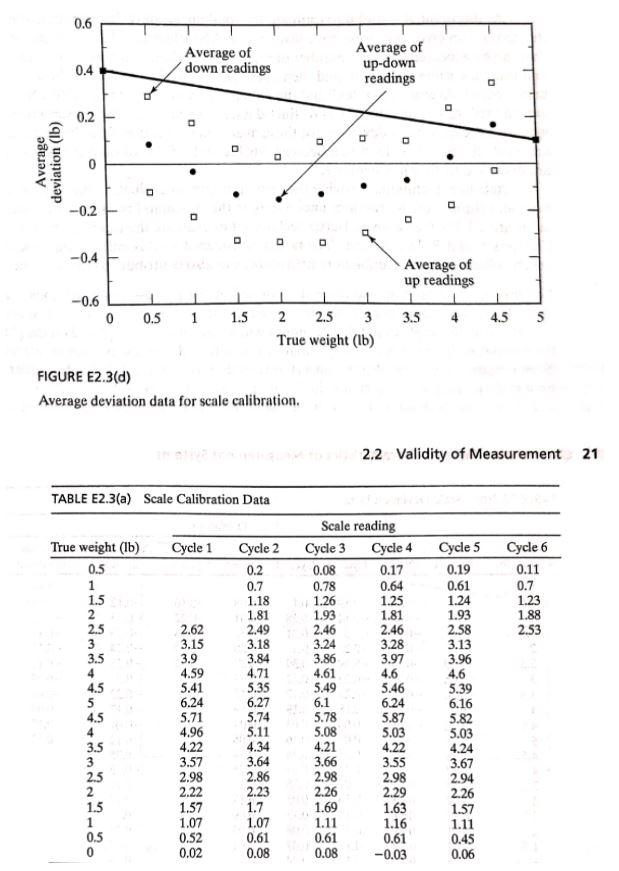
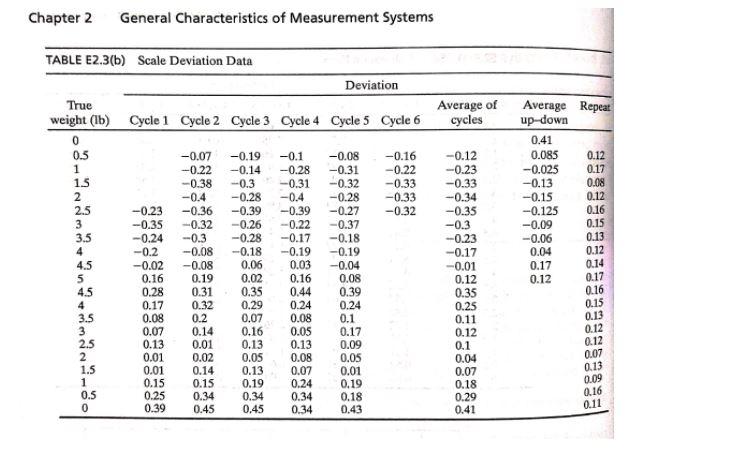
Also generate the following plots from your Matlab program: i. The linear fit plot from the scale readings similar to Figure E2.3(b) (page 21) The deviation plot similar to Figure E2.3(c) (page 22) and iii. The average deviation plot similar to Figure E2.3(d) (page 23) 7 6 5 Best fit line Scale reading (lb) 3 2 1 0 -1 0 0.5 1 1.5 3.5 4 4.5 5 2 2.5 3 True weight (lb) FIGURE E2.3(b) Plot of scale readings. FIGURE E2.3(b) Plot of scale readings. 0.6 0.4 X X X 0.2 >X X X Accuracy limits XXX KX Deviation (lb) XX X 0 Xoc boxx XK XOX -0.2 X X XOX X X X boxx xx XX XOX -0.4 -0.6 0 0.5 1 1.5 3.5 4 4.5 u 2 2.5 3 True weight (lb) FIGURE E2.3(c) Plot of deviation data for scale calibration. 0.6 Average of down readings 0.4 Average of up-down readings 0.2 . . . Average deviation (lb) . a . . O -0.2 0 0 -0.4 Average of up readings -0.6 0 0.5 1 1.5 2 3.5 4 4.5 A 2 2.5 3 True weight (lb) FIGURE E2.3(d) Average deviation data for scale calibration. 2.2 Validity of Measurement 21 TABLE E2.3(a) Scale Calibration Data True weight (lb) Cycle 1 0.5 Cycle 6 0.11 0.7 1.23 1.88 2.53 1 1.5 2 2.5 3 1.26 3.5 3.86 4 4.5 5 Cycle 2 0.2 0.7 1.18 1.81 2.49 3.18 3.84 4.71 5.35 6.27 5.74 5.11 4.34 3.64 2.86 2.23 1.7 1.07 0.61 0.08 Scale reading Cycle 3 Cycle 4 0.08 0.17 0.78 0.64 1.25 1.93 1.81 2.46 2.46 3.24 3.28 3.97 4.61 4.6 5.49 5.46 6.24 5.78 5.87 5.08 5.03 4.21 4.22 3.66 3.55 2.98 2.26 2.29 1.69 1.63 1.11 1.16 0.61 0.61 0.08 -0.03 6.1 2.62 3.15 3.9 4.59 5.41 6.24 5.71 4.96 4.22 3.57 2.98 2.22 1.57 1.07 0.52 0.02 Cycle 5 0.19 0.61 1.24 1.93 2.58 3.13 3.96 4.6 5.39 6.16 5.82 5.03 4.24 3.67 2.94 2.26 1.57 1.11 0.45 0.06 4.5 4 3.5 3 2.5 2 1.5 1 2.98 0.5 0 Chapter 2 General Characteristics of Measurement Systems Average of cycles Repeat TABLE E2.3(b) Scale Deviation Data Deviation True weight (lb) Cycle 1 Cycle 2 Cycle 3 Cycle 4 Cycle 5 Cycle 6 0 0.5 -0.07 -0.19 -0.1 -0.08 -0.16 1 -0.22 -0.14 -0.28 -0.31 -0.22 1.5 -0.38 -0.3 -0.31 -0.32 -0.33 2 -0.4 -0.28 -0.4 -0.28 -0.33 2.5 -0.23 -0.36 -0.39 -0.39 -0.27 -0.32 3 -0.35 -0.32 -0.26 -0.22 -0.37 3.5 -0.24 -0.3 -0.28 -0.17 -0.18 4 -0.2 -0.08 -0.18 -0.19 -0.19 4.5 -0.02 -0.08 0.06 0.03 -0.04 5 0.16 0.19 0.02 0.16 0.08 45 0.28 0.31 0.35 0.44 0.39 4 0.17 0.32 0.29 0.24 0.24 3.5 0.08 0.2 0.07 0.08 3 0.07 0.14 0.16 0.05 0.17 2.5 0.13 0.01 0.13 0.13 0.09 2 0.01 0.02 0.05 0.08 0.05 1.5 0.01 0.14 0.13 0.07 0.01 1 0.15 0.15 0.19 0.24 0.19 0.5 0.25 0.34 0.34 0.34 0.18 0 0.39 0.45 0.45 0.34 0.43 Average up-down 0.41 0.085 -0.025 -0.13 -0.15 -0.125 -0.09 -0.06 0.04 0.17 0.12 -0.12 -0.23 -0.33 -0.34 -0.35 -0.3 -0.23 -0.17 -0.01 0.12 0.35 0.25 0.11 0.12 0.1 0.04 0.07 0.18 0.29 0.41 0.12 0.17 0.08 0.12 0.16 0.15 0.13 0.12 0.14 0.17 0.1 0.16 0.15 0.13 0.12 0.12 0.07 0.13 0.09 0.16 0.11 Also generate the following plots from your Matlab program: i. The linear fit plot from the scale readings similar to Figure E2.3(b) (page 21) The deviation plot similar to Figure E2.3(c) (page 22) and iii. The average deviation plot similar to Figure E2.3(d) (page 23) 7 6 5 Best fit line Scale reading (lb) 3 2 1 0 -1 0 0.5 1 1.5 3.5 4 4.5 5 2 2.5 3 True weight (lb) FIGURE E2.3(b) Plot of scale readings. FIGURE E2.3(b) Plot of scale readings. 0.6 0.4 X X X 0.2 >X X X Accuracy limits XXX KX Deviation (lb) XX X 0 Xoc boxx XK XOX -0.2 X X XOX X X X boxx xx XX XOX -0.4 -0.6 0 0.5 1 1.5 3.5 4 4.5 u 2 2.5 3 True weight (lb) FIGURE E2.3(c) Plot of deviation data for scale calibration. 0.6 Average of down readings 0.4 Average of up-down readings 0.2 . . . Average deviation (lb) . a . . O -0.2 0 0 -0.4 Average of up readings -0.6 0 0.5 1 1.5 2 3.5 4 4.5 A 2 2.5 3 True weight (lb) FIGURE E2.3(d) Average deviation data for scale calibration. 2.2 Validity of Measurement 21 TABLE E2.3(a) Scale Calibration Data True weight (lb) Cycle 1 0.5 Cycle 6 0.11 0.7 1.23 1.88 2.53 1 1.5 2 2.5 3 1.26 3.5 3.86 4 4.5 5 Cycle 2 0.2 0.7 1.18 1.81 2.49 3.18 3.84 4.71 5.35 6.27 5.74 5.11 4.34 3.64 2.86 2.23 1.7 1.07 0.61 0.08 Scale reading Cycle 3 Cycle 4 0.08 0.17 0.78 0.64 1.25 1.93 1.81 2.46 2.46 3.24 3.28 3.97 4.61 4.6 5.49 5.46 6.24 5.78 5.87 5.08 5.03 4.21 4.22 3.66 3.55 2.98 2.26 2.29 1.69 1.63 1.11 1.16 0.61 0.61 0.08 -0.03 6.1 2.62 3.15 3.9 4.59 5.41 6.24 5.71 4.96 4.22 3.57 2.98 2.22 1.57 1.07 0.52 0.02 Cycle 5 0.19 0.61 1.24 1.93 2.58 3.13 3.96 4.6 5.39 6.16 5.82 5.03 4.24 3.67 2.94 2.26 1.57 1.11 0.45 0.06 4.5 4 3.5 3 2.5 2 1.5 1 2.98 0.5 0 Chapter 2 General Characteristics of Measurement Systems Average of cycles Repeat TABLE E2.3(b) Scale Deviation Data Deviation True weight (lb) Cycle 1 Cycle 2 Cycle 3 Cycle 4 Cycle 5 Cycle 6 0 0.5 -0.07 -0.19 -0.1 -0.08 -0.16 1 -0.22 -0.14 -0.28 -0.31 -0.22 1.5 -0.38 -0.3 -0.31 -0.32 -0.33 2 -0.4 -0.28 -0.4 -0.28 -0.33 2.5 -0.23 -0.36 -0.39 -0.39 -0.27 -0.32 3 -0.35 -0.32 -0.26 -0.22 -0.37 3.5 -0.24 -0.3 -0.28 -0.17 -0.18 4 -0.2 -0.08 -0.18 -0.19 -0.19 4.5 -0.02 -0.08 0.06 0.03 -0.04 5 0.16 0.19 0.02 0.16 0.08 45 0.28 0.31 0.35 0.44 0.39 4 0.17 0.32 0.29 0.24 0.24 3.5 0.08 0.2 0.07 0.08 3 0.07 0.14 0.16 0.05 0.17 2.5 0.13 0.01 0.13 0.13 0.09 2 0.01 0.02 0.05 0.08 0.05 1.5 0.01 0.14 0.13 0.07 0.01 1 0.15 0.15 0.19 0.24 0.19 0.5 0.25 0.34 0.34 0.34 0.18 0 0.39 0.45 0.45 0.34 0.43 Average up-down 0.41 0.085 -0.025 -0.13 -0.15 -0.125 -0.09 -0.06 0.04 0.17 0.12 -0.12 -0.23 -0.33 -0.34 -0.35 -0.3 -0.23 -0.17 -0.01 0.12 0.35 0.25 0.11 0.12 0.1 0.04 0.07 0.18 0.29 0.41 0.12 0.17 0.08 0.12 0.16 0.15 0.13 0.12 0.14 0.17 0.1 0.16 0.15 0.13 0.12 0.12 0.07 0.13 0.09 0.16 0.11
Step by Step Solution
There are 3 Steps involved in it

Get step-by-step solutions from verified subject matter experts