

Question: also having trouble solving this problem will leave a like, I appreiciate the help 2. Consider the over-shooting model we studied in class and under
also having trouble solving this problem will leave a like, I appreiciate the help
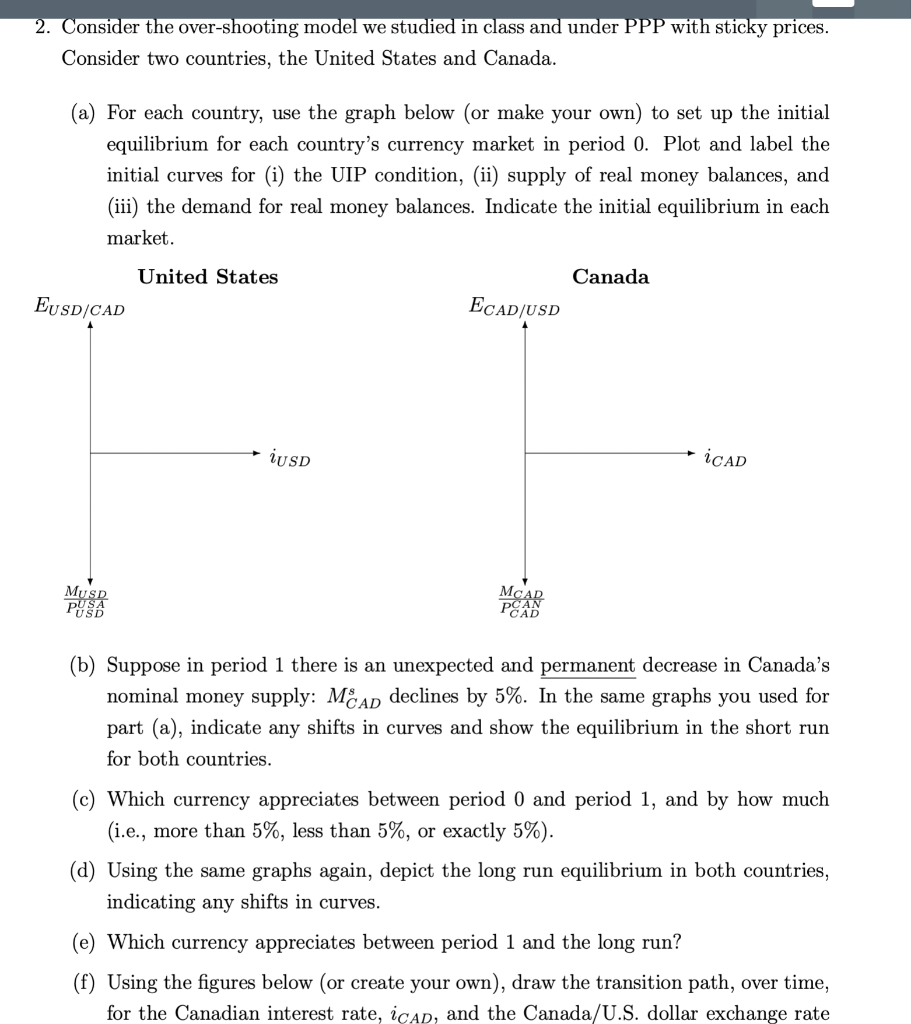
2. Consider the over-shooting model we studied in class and under PPP with sticky prices. Consider two countries, the United States and Canada. (a) For each country, use the graph below (or make your own) to set up the initial equilibrium for each country's currency market in period 0. Plot and label the initial curves for (i) the UIP condition, (ii) supply of real money balances, and (iii) the demand for real money balances. Indicate the initial equilibrium in each market. (b) Suppose in period 1 there is an unexpected and permanent decrease in Canada's nominal money supply: MCADs declines by 5%. In the same graphs you used for part (a), indicate any shifts in curves and show the equilibrium in the short run for both countries. (c) Which currency appreciates between period 0 and period 1, and by how much (i.e., more than 5%, less than 5%, or exactly 5% ). (d) Using the same graphs again, depict the long run equilibrium in both countries, indicating any shifts in curves. (e) Which currency appreciates between period 1 and the long run? (f) Using the figures below (or create your own), draw the transition path, over time, for the Canadian interest rate, iCAD, and the Canada/U.S. dollar exchange rate 2. Consider the over-shooting model we studied in class and under PPP with sticky prices. Consider two countries, the United States and Canada. (a) For each country, use the graph below (or make your own) to set up the initial equilibrium for each country's currency market in period 0. Plot and label the initial curves for (i) the UIP condition, (ii) supply of real money balances, and (iii) the demand for real money balances. Indicate the initial equilibrium in each market. (b) Suppose in period 1 there is an unexpected and permanent decrease in Canada's nominal money supply: MCADs declines by 5%. In the same graphs you used for part (a), indicate any shifts in curves and show the equilibrium in the short run for both countries. (c) Which currency appreciates between period 0 and period 1, and by how much (i.e., more than 5%, less than 5%, or exactly 5% ). (d) Using the same graphs again, depict the long run equilibrium in both countries, indicating any shifts in curves. (e) Which currency appreciates between period 1 and the long run? (f) Using the figures below (or create your own), draw the transition path, over time, for the Canadian interest rate, iCAD, and the Canada/U.S. dollar exchange rate
Step by Step Solution
There are 3 Steps involved in it

Get step-by-step solutions from verified subject matter experts