

Question: Also looking for test statistic rounded to 2 decimal places A statistical program is recommended. You may need to use this table to answer this
Also looking for test statistic rounded to 2 decimal places
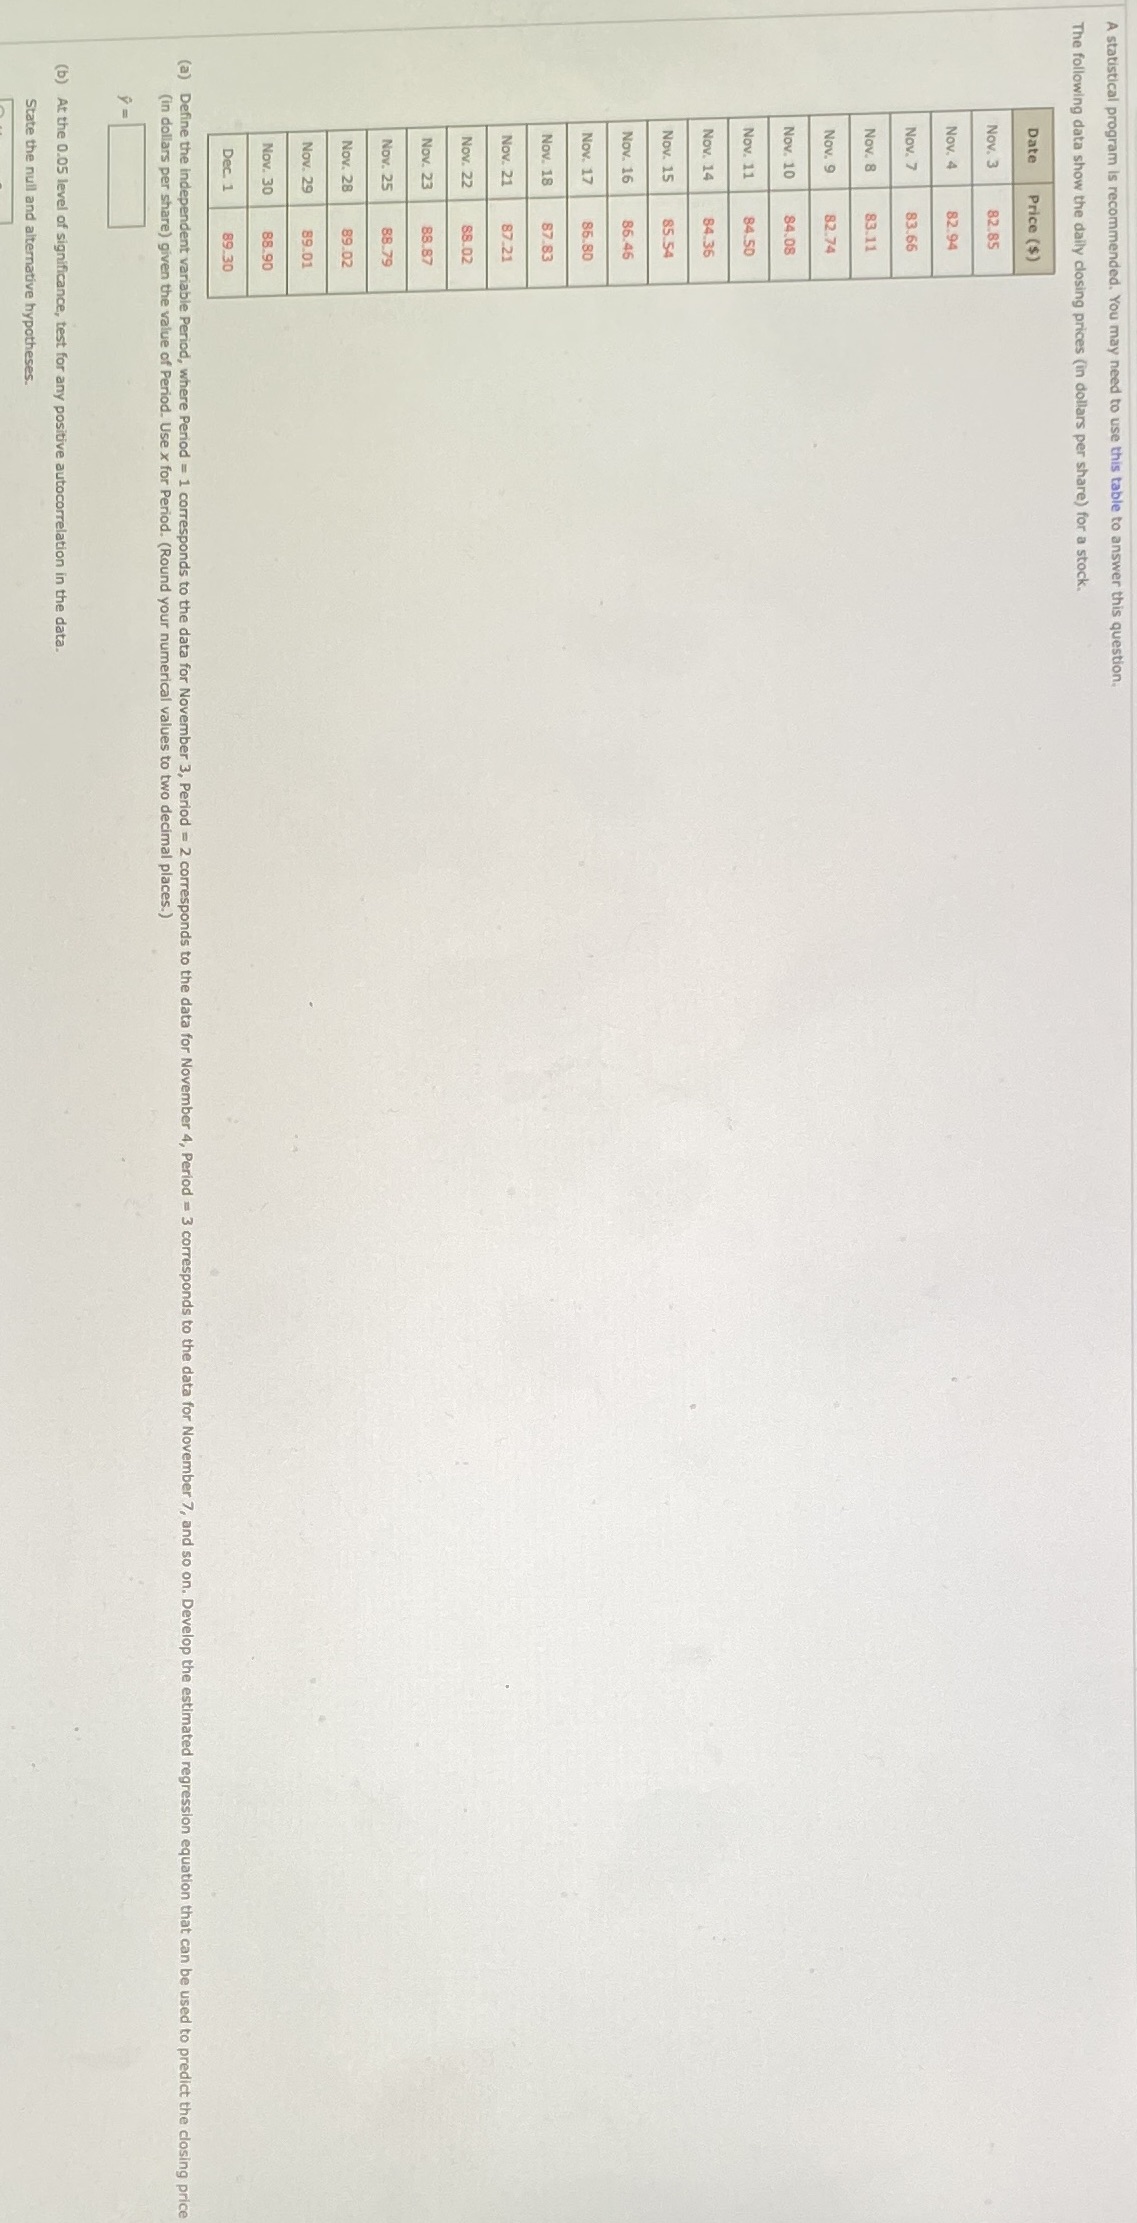
A statistical program is recommended. You may need to use this table to answer this question. The following data show the daily closing prices (in dollars per share) for a stock. Date Price ($) Nov. 3 82.85 Nov. 4 82.94 Nov. 7 83.66 Nov. 8 83.11 Nov. 9 82.74 Nov. 10 84.08 Nov. 11 84.50 Nov. 14 84.36 Nov. 15 85.54 Nov. 16 86.46 Nov. 17 86.80 Nov. 18 87 83 Nov. 21 87.21 Nov. 22 68.02 Nov. 23 88 87 Nov. 25 38.79 Nov. 28 39.02 Nov. 29 89.01 Nov. 30 88.90 Dec. 1 89.30 (a) Define the independent variable Period, where Period = 1 corresponds to the data for November 3, Period = 2 corresponds to the data for November 4, Period = 3 corresponds to the data for November 7, and so on. Develop the estimated regression equation that can be used to predict the closing price (in dollars per share) given the value of Period. Use x for Period. (Round your numerical values to two decimal places.) (b) At the 0.05 level of significance, test for any positive autocorrelation in the data. State the null and alternative hypotheses
Step by Step Solution
There are 3 Steps involved in it

Get step-by-step solutions from verified subject matter experts