

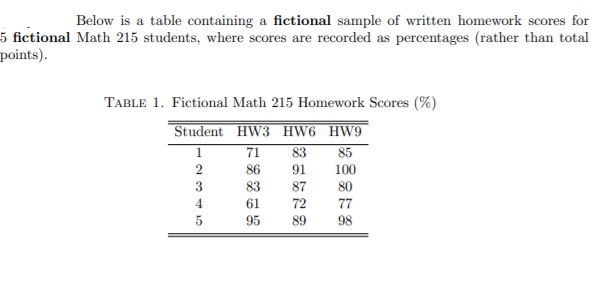
Question: Although this data is fictional, let's assume that it reflects a real trend, in the sense that forthese 5 students, their scores on HW9 can
Although this data is fictional, let's assume that it reflects a real trend, in the sense that forthese 5 students, their scores on HW9 can be reasonably predicted by their scores on HW3and HW6.A) Find an equation which best fits this data in the least squares sense, and which predictsthe HW9 score h9 as a linear function of the score h3 on HW3 and the score h6 on HW6,meaning that : ah3+bh6+c=h9B) If this data were from the current semester (it's not), you could use your model from(a) to predict your own HW9 score based on how you did on HW3 and HW6. Chooseone of the 5 fictional students, and decide whether theirs are betterestimated by this model; draw a picture which illustrates geometrically the rationale foryour decision.
Step by Step Solution
There are 3 Steps involved in it

Get step-by-step solutions from verified subject matter experts