

Ameritrade decided to relax it's policy and only monitor trades within 90% of the normal distribution...
Fantastic news! We've Found the answer you've been seeking!
Question:
Transcribed Image Text:
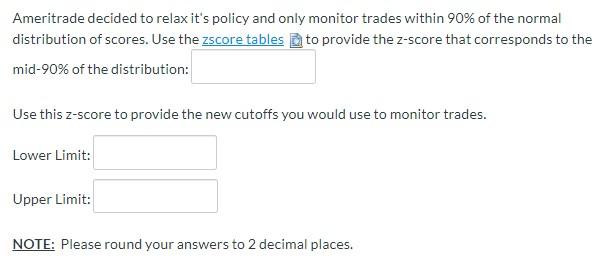
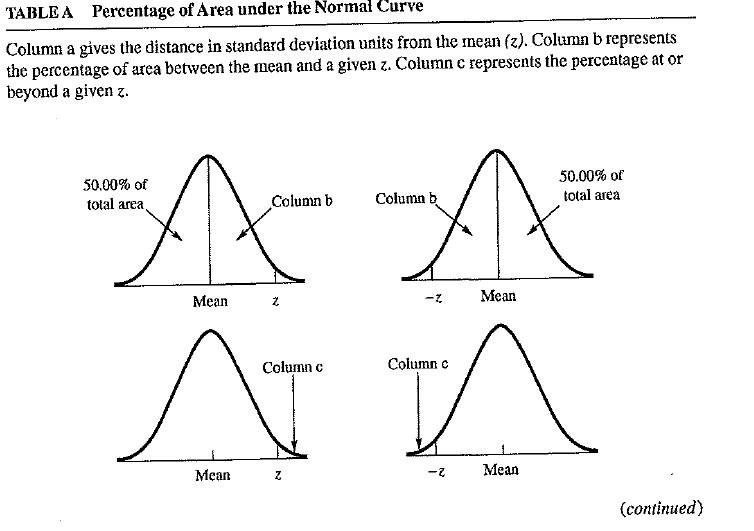
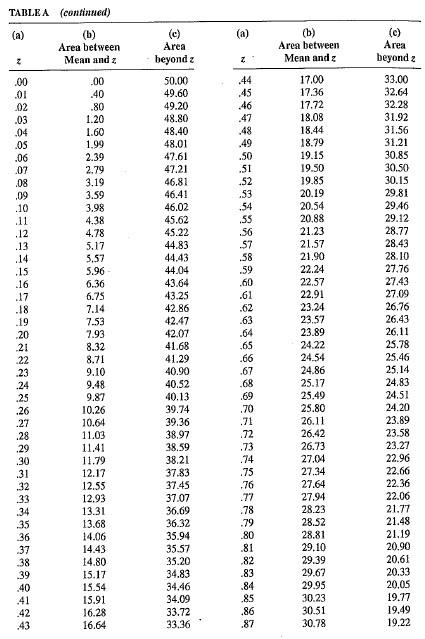
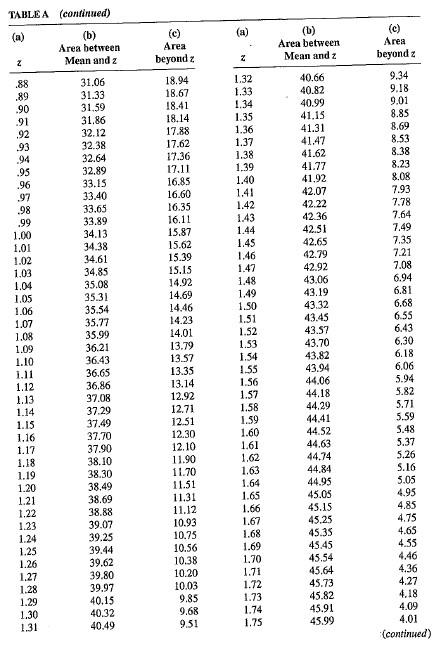
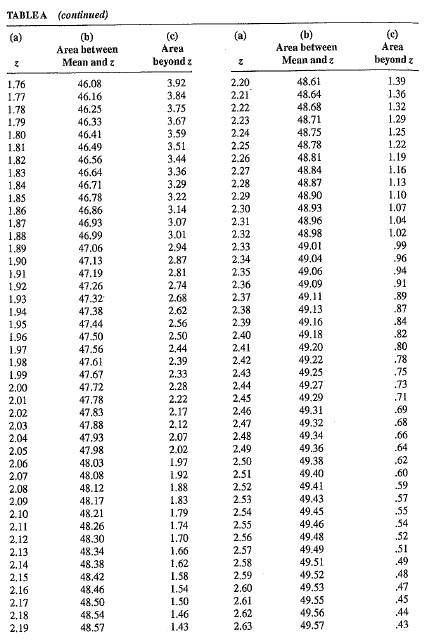
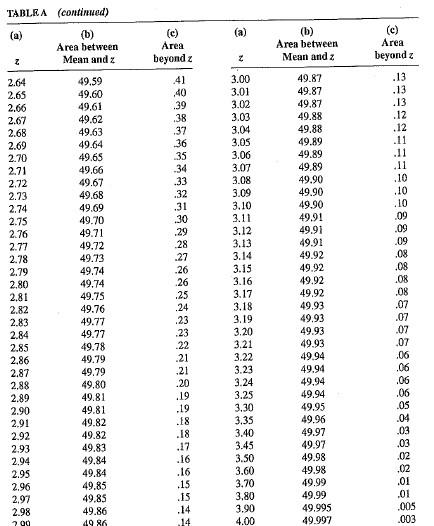
Ameritrade decided to relax it's policy and only monitor trades within 90% of the normal distribution of scores. Use the zscore tables to provide the z-score that corresponds to the mid-90% of the distribution: Use this z-score to provide the new cutoffs you would use to monitor trades. Lower Limit: Upper Limit: NOTE: Please round your answers to 2 decimal places. TABLE A Percentage of Area under the Normal Curve Column a gives the distance in standard deviation units from the mean (z). Column b represents the percentage of area between the mean and a given z. Column c represents the percentage at or beyond a given z. A Mean 50.00% of total area, Mean Column b Z Column c N 50.00% of total area A Mean Column b -1 Column c -2 Mean (continued) TABLEA (continued) (a) (b) Area between Mean and z z .00 .01 02 .03 04 .05 .06 .07 08 .09 .10 11 .12 .13 .14 .15 16 .17 .18 .19 20 21 22 .23 .24 25 .26 .27 .28 .29 .30 .31 32 33 34 .35 36 .37 38 39 40 41 42 43 .00 .40 .80 1.20 1.60 1.99 2.39 2.79 3.19 3.59 3.98 4.38 4.78 5.17 5.57 5.96 6.36 6.75 7.14 7.53 7.93 8.32 8.71 9.10 9.48 9.87 10.26 10.64 11.03 11.41 11.79 12.17 12.55 12.93 13.31 13.68 14.06 14.43 14.80 15.17 15.54 15.91 16.28 16.64 Area beyond z 50.00 49.60 49.20 48.80 48.40 48.01 47.61 47.21 46.81 46.41 46.02 45.62 45.22 44.83 44.43 44.04 43.64 43.25 42.86 42.47 42.07 41.68 41.29 40.90 40.52 40.13 39.74 39.36 38.97 38.59 38.21 37.83 37.45 37.07 36.69 36.32 35.94 35.57 35.20 34.83 34.46 34.09 33.72 33.36 (a) Z 44 .45 46 47 48 .49 .50 51 .52 53 54 .55 .56 57 .58 .59 .60 .61 .62 .63 .64 .65 .66 .67 .68 .69 .70 .71 .72 .73 .74 .75 .76 .77 .78 .79 .80 .81 82 .83 .84 .85 .86 .87 (b) Area between Mean and g 17.00 17.36 17.72 18.08 18.44 18.79 19.15 19.50 19.85 20.19 20.54 20.88 21.23 21.57 21.90 22.24 22.57 22.91 23.24 23.57 23.89 24.22 24.54 24.86 25.17 25.49 25.80 26.11 26.42 26.73 27.04 27.34 27.64 27.94 28.23 28.52 28.81 29.10 29.39 29.67 29.95 30.23 30.51 30.78 (c) Area beyond z 33.00 32.64 32.28 31.92 31.56 31.21 30.85 30.50 30.15 29.81 29.46 29.12 28.77 28.43 28.10 27.76 27.43 27.09 26.76 26.43 26,11 25.78 25.46 25,14 24.83 24.51 24.20 23.89 23.58 23.27 22.96 22.66 22.36 22.06 21.77 21.48 21.19 20.90 20.61 20.33 20.05 19.77 19.49 19.22 TABLE A (continued) (a) (b) Area between Mean and z Z .88 .89 .90 .91 .92 .93 94 .95 .96 97 98 .99 1.00 1.01 1.02 1.03 1.04 1.05 1.06 1.07 1.08 1.09 1.10 1.11 1.12 1.13 1.14 1.15 1.16 1.17 1.18 1.19 1.20 1.21 1.22 1.23 1.24 1.25 1.26 1,27 1.28 1.29 1.30 1.31 31.06 31.33 31.59 31.86 32.12 32.38 32.64 32,89 33.15 33.40 33.65 33.89 34.13 34.38 34.61 34.85 35.08 35.31 35.54 35.77 35.99 36.21 36.43 36.65 36.86 37.08 37.29 37.49 37.70 37.90 38.10 38.30 38,49 38.69 38.88 39.07 39.25 39.44 39.62 39.80 39.97 40.15 40.32 40.49 (c) Area beyond z 18.94 18.67 18.41 18.14 17.88 17.62 17.36 17.11 16.85 16.60 16.35 16.11 15.87 15.62 15.39 15.15 14.92 14.69 14.46 14.23 14.01 13.79 13.57 13.35 13.14 12.92 12.71 12.51 12.30 12.10 11.90 11.70 11.51 11.31 11.12 10.93 10.75 10.56 10.38 10.20 10.03 9.85 9.68 9.51 (a) 2 1.32 1.33 1.34 1.35 1.36 1.37 1.38 1.39 1.40 1.41 1.42 1.43 1.44 1.45 1.46 1.47 1.48 1.49 1.50 1.51 1.52 1.53 1.54 1.55 1.56 1.57 1.58 1.59 1.60 1.61 1.62 1.63 1.64 1.65 1.66 1.67 1.68 1.69 1.70 1.71 1.72 1.73 1.74 1.75 (b) Area between Mean and z 40.66 40.82 40.99 41.15 41.31 41.47 41.62 41.77 41.92 42.07 42.22 42.36 42.51 42.65 42.79 42.92 43.06 43.19 43.32 43.45 43.57 43.70 43.82 43.94 44.06 44.18 44.29 44.41 44.52 44.63 44.74 44.84 44.95 45.05 45.15 45.25 45.35 45.45 45.54 45.64 45.73 45.82 45.91 45.99 (c) Area beyond z 9.34 9.18 9.01 8.85 8.69 8.53 8.38 8.23 8.08 7.93 7.78 7.64 7.49 7.35 7.21 7.08 6.94 6.81 6.68 6.55 6.43 6.30 6.18 6.06 5.94 5.82 5.71 5.59 5.48 5.37 5.26 5.16 5.05 4.95 4.85 4.75 4.65 4.55 4.46 4.36 4.27 4.18 4.09 4.01 (continued) TABLEA (continued) (a) (b) Area between Mean and z z 1.76 1.77 1.78 1.79 1.80 1.81 1.82 1.83 1.84 1.85 1.86 1,87 1.88 1.89 1,90 1.91 1.92 1.93 1.94 1.95 1.96 1.97 1.98 1.99 2.00 2.01 2.02 2.03 2.04 2.05 2.06 2.07 2.08 2.09 2.10 2.11 2,12 2.13 2.14 2,15 2.16 2.17 2,18 2.19 46.08 46.16 46.25 46.33 46.41 46.49 46.56 46.64 46.71 46.78 46.86 46.93 46.99 47.06 47.13 47.19 47.26 47.32 47.38 47.44 47.50 47.56 47.61 47.67 47.72 47.78 47.83 47.88 47.93 47.98 48.03 48.08 48.12 48.17 48.21 48.26 48.30 48.34 48.38 48.42 48.46 48.50 48.54 48.57 (c) Area beyond z 3.92 3.84 3.75 3.67 3.59 3.51 3.44 3.36 3.29 3.22 3.14 3.07 3.01 2.94 2.87 2.81 2.74 2.68 2.62 2.56 2.50 2,44 2.39 2.33 2.28 2.22 2.17 2,12 2.07 2.02 1.97 1.92 1.88 1.83 1.79 1.74 1.70 1.66 1,62 1.58 1.54 1.50 1.46 1.43 z 2.20 2.21 2.22 2.23 2.24 2.25 2,26 2.27 2.28 2.29 2.30 2.31 2.32 2.33 2.34 2.35 2.36 2.37 2.38 2.39 2.40 2.41 2,42 2.43 2.44 2,45 2.46 2,47 2.48 2.49 2,50 2.51 2.52 2.53 2.54 2.55 2.56 2.57 2.58 2,59 2.60 2.61 2.62 2.63 (b) Area between Mean and z 48.61 48.64 48.68 48.71 48.75 48.78 48.81 48.84 48.87 48.90 48.93 48.96 48.98 49.01 49,04 49.06 49.09 49.11 49.13 49.16 49.18 49.20 49.22 49.25 49.27 49,29 49.31 49.32 49.34 49.36 49.38 49.40 49.41 49.43 49.45 49.46 49.48 49.49 49.51 49.52 49.53 49.55 49.56 49.57 (c) Area beyond z 1.39 1.36 1.32 1.29 1.25 1.22 1.19 1.16 1.13 1.10 1.07 1.04 1.02 .99 .96 .94 91 .89 .87 .84 .82 .80 .78 75 .73 .71 .69 .68 .66 .64 .62 .60 59 57 .55 54 .52 .51 .49 .48 .47 45 44 43 TABLEA (continued) (a) (b) Area between Mean and z Z 2.64 2.65 2.66 2.67 2.68 2.69 2.70 2.71 2.72 2.73 2.74 2.75 2.76 2.77 2.78 2.79 2,80 2,81 2.82 2.83 2.84 2.85 2,86 2.87 2.88 2.89 2.90 2.91 2.92 2.93 2.94 2.95 2.96 2,97 2.98 7.99 49.59 49.60 49.61 49.62 49.63 49.64 49.65 49.66 49.67 49.68 49.69 49.70 49.71 49.72 49.73 49.74 49.74 49.75 49.76 49.77 49.77 49.78 49.79 49.79 49.80 49.81 49.81 49.82 49.82 49.83 49.84 49.84 49.85 49.85 49.86 49 86 (c) Area beyond z 41 40 .39 38. .37 36 35 34 .33 .32 .31 .30 .29 28 .27 26 .26 .25 .24 .23 23 .22 .21 21 .20 .19 .19 .18 .18 17 .16 .16 .15 15 .14 14 (a) Z 3.00 3.01 3.02 3.03 3.04 3.05 3.06 3.07 3.08 3.09 3.10 3.11 3.12 3.13 3.14 3.15 3.16 3.17 3.18 3.19 3.20 3.21 3.22 3.23 3.24 3.25 3.30 3.35 3.40 3.45 3.50 3.60 3.70 3,80 3.90 4.00 (b) Area between Mean and z 49.87 49.87 49.87 49.88 49.88 49.89 49.89 49.89 49.90 49.90 49.90 49.91 49.91 49.91 49.92 49.92 49.92 49.92 49.93 49.93 49.93 49.93 49.94 49.94 49,94 49.94 49.95 49.96 49.97 49.97 49.98 49.98 49.99 49.99 49.995 49.997 Area beyond z .13 .13 .13 .12 .12 .11 11 .11 .10 .10 .10 .09 .09 .09 .08 .08 .08 08 .07 .07 .07 .07 .06 .06 .06 .06 .05 .04 .03 ,03 .02 .02 .01 .01 ,005 .003 Ameritrade decided to relax it's policy and only monitor trades within 90% of the normal distribution of scores. Use the zscore tables to provide the z-score that corresponds to the mid-90% of the distribution: Use this z-score to provide the new cutoffs you would use to monitor trades. Lower Limit: Upper Limit: NOTE: Please round your answers to 2 decimal places. TABLE A Percentage of Area under the Normal Curve Column a gives the distance in standard deviation units from the mean (z). Column b represents the percentage of area between the mean and a given z. Column c represents the percentage at or beyond a given z. A Mean 50.00% of total area, Mean Column b Z Column c N 50.00% of total area A Mean Column b -1 Column c -2 Mean (continued) TABLEA (continued) (a) (b) Area between Mean and z z .00 .01 02 .03 04 .05 .06 .07 08 .09 .10 11 .12 .13 .14 .15 16 .17 .18 .19 20 21 22 .23 .24 25 .26 .27 .28 .29 .30 .31 32 33 34 .35 36 .37 38 39 40 41 42 43 .00 .40 .80 1.20 1.60 1.99 2.39 2.79 3.19 3.59 3.98 4.38 4.78 5.17 5.57 5.96 6.36 6.75 7.14 7.53 7.93 8.32 8.71 9.10 9.48 9.87 10.26 10.64 11.03 11.41 11.79 12.17 12.55 12.93 13.31 13.68 14.06 14.43 14.80 15.17 15.54 15.91 16.28 16.64 Area beyond z 50.00 49.60 49.20 48.80 48.40 48.01 47.61 47.21 46.81 46.41 46.02 45.62 45.22 44.83 44.43 44.04 43.64 43.25 42.86 42.47 42.07 41.68 41.29 40.90 40.52 40.13 39.74 39.36 38.97 38.59 38.21 37.83 37.45 37.07 36.69 36.32 35.94 35.57 35.20 34.83 34.46 34.09 33.72 33.36 (a) Z 44 .45 46 47 48 .49 .50 51 .52 53 54 .55 .56 57 .58 .59 .60 .61 .62 .63 .64 .65 .66 .67 .68 .69 .70 .71 .72 .73 .74 .75 .76 .77 .78 .79 .80 .81 82 .83 .84 .85 .86 .87 (b) Area between Mean and g 17.00 17.36 17.72 18.08 18.44 18.79 19.15 19.50 19.85 20.19 20.54 20.88 21.23 21.57 21.90 22.24 22.57 22.91 23.24 23.57 23.89 24.22 24.54 24.86 25.17 25.49 25.80 26.11 26.42 26.73 27.04 27.34 27.64 27.94 28.23 28.52 28.81 29.10 29.39 29.67 29.95 30.23 30.51 30.78 (c) Area beyond z 33.00 32.64 32.28 31.92 31.56 31.21 30.85 30.50 30.15 29.81 29.46 29.12 28.77 28.43 28.10 27.76 27.43 27.09 26.76 26.43 26,11 25.78 25.46 25,14 24.83 24.51 24.20 23.89 23.58 23.27 22.96 22.66 22.36 22.06 21.77 21.48 21.19 20.90 20.61 20.33 20.05 19.77 19.49 19.22 TABLE A (continued) (a) (b) Area between Mean and z Z .88 .89 .90 .91 .92 .93 94 .95 .96 97 98 .99 1.00 1.01 1.02 1.03 1.04 1.05 1.06 1.07 1.08 1.09 1.10 1.11 1.12 1.13 1.14 1.15 1.16 1.17 1.18 1.19 1.20 1.21 1.22 1.23 1.24 1.25 1.26 1,27 1.28 1.29 1.30 1.31 31.06 31.33 31.59 31.86 32.12 32.38 32.64 32,89 33.15 33.40 33.65 33.89 34.13 34.38 34.61 34.85 35.08 35.31 35.54 35.77 35.99 36.21 36.43 36.65 36.86 37.08 37.29 37.49 37.70 37.90 38.10 38.30 38,49 38.69 38.88 39.07 39.25 39.44 39.62 39.80 39.97 40.15 40.32 40.49 (c) Area beyond z 18.94 18.67 18.41 18.14 17.88 17.62 17.36 17.11 16.85 16.60 16.35 16.11 15.87 15.62 15.39 15.15 14.92 14.69 14.46 14.23 14.01 13.79 13.57 13.35 13.14 12.92 12.71 12.51 12.30 12.10 11.90 11.70 11.51 11.31 11.12 10.93 10.75 10.56 10.38 10.20 10.03 9.85 9.68 9.51 (a) 2 1.32 1.33 1.34 1.35 1.36 1.37 1.38 1.39 1.40 1.41 1.42 1.43 1.44 1.45 1.46 1.47 1.48 1.49 1.50 1.51 1.52 1.53 1.54 1.55 1.56 1.57 1.58 1.59 1.60 1.61 1.62 1.63 1.64 1.65 1.66 1.67 1.68 1.69 1.70 1.71 1.72 1.73 1.74 1.75 (b) Area between Mean and z 40.66 40.82 40.99 41.15 41.31 41.47 41.62 41.77 41.92 42.07 42.22 42.36 42.51 42.65 42.79 42.92 43.06 43.19 43.32 43.45 43.57 43.70 43.82 43.94 44.06 44.18 44.29 44.41 44.52 44.63 44.74 44.84 44.95 45.05 45.15 45.25 45.35 45.45 45.54 45.64 45.73 45.82 45.91 45.99 (c) Area beyond z 9.34 9.18 9.01 8.85 8.69 8.53 8.38 8.23 8.08 7.93 7.78 7.64 7.49 7.35 7.21 7.08 6.94 6.81 6.68 6.55 6.43 6.30 6.18 6.06 5.94 5.82 5.71 5.59 5.48 5.37 5.26 5.16 5.05 4.95 4.85 4.75 4.65 4.55 4.46 4.36 4.27 4.18 4.09 4.01 (continued) TABLEA (continued) (a) (b) Area between Mean and z z 1.76 1.77 1.78 1.79 1.80 1.81 1.82 1.83 1.84 1.85 1.86 1,87 1.88 1.89 1,90 1.91 1.92 1.93 1.94 1.95 1.96 1.97 1.98 1.99 2.00 2.01 2.02 2.03 2.04 2.05 2.06 2.07 2.08 2.09 2.10 2.11 2,12 2.13 2.14 2,15 2.16 2.17 2,18 2.19 46.08 46.16 46.25 46.33 46.41 46.49 46.56 46.64 46.71 46.78 46.86 46.93 46.99 47.06 47.13 47.19 47.26 47.32 47.38 47.44 47.50 47.56 47.61 47.67 47.72 47.78 47.83 47.88 47.93 47.98 48.03 48.08 48.12 48.17 48.21 48.26 48.30 48.34 48.38 48.42 48.46 48.50 48.54 48.57 (c) Area beyond z 3.92 3.84 3.75 3.67 3.59 3.51 3.44 3.36 3.29 3.22 3.14 3.07 3.01 2.94 2.87 2.81 2.74 2.68 2.62 2.56 2.50 2,44 2.39 2.33 2.28 2.22 2.17 2,12 2.07 2.02 1.97 1.92 1.88 1.83 1.79 1.74 1.70 1.66 1,62 1.58 1.54 1.50 1.46 1.43 z 2.20 2.21 2.22 2.23 2.24 2.25 2,26 2.27 2.28 2.29 2.30 2.31 2.32 2.33 2.34 2.35 2.36 2.37 2.38 2.39 2.40 2.41 2,42 2.43 2.44 2,45 2.46 2,47 2.48 2.49 2,50 2.51 2.52 2.53 2.54 2.55 2.56 2.57 2.58 2,59 2.60 2.61 2.62 2.63 (b) Area between Mean and z 48.61 48.64 48.68 48.71 48.75 48.78 48.81 48.84 48.87 48.90 48.93 48.96 48.98 49.01 49,04 49.06 49.09 49.11 49.13 49.16 49.18 49.20 49.22 49.25 49.27 49,29 49.31 49.32 49.34 49.36 49.38 49.40 49.41 49.43 49.45 49.46 49.48 49.49 49.51 49.52 49.53 49.55 49.56 49.57 (c) Area beyond z 1.39 1.36 1.32 1.29 1.25 1.22 1.19 1.16 1.13 1.10 1.07 1.04 1.02 .99 .96 .94 91 .89 .87 .84 .82 .80 .78 75 .73 .71 .69 .68 .66 .64 .62 .60 59 57 .55 54 .52 .51 .49 .48 .47 45 44 43 TABLEA (continued) (a) (b) Area between Mean and z Z 2.64 2.65 2.66 2.67 2.68 2.69 2.70 2.71 2.72 2.73 2.74 2.75 2.76 2.77 2.78 2.79 2,80 2,81 2.82 2.83 2.84 2.85 2,86 2.87 2.88 2.89 2.90 2.91 2.92 2.93 2.94 2.95 2.96 2,97 2.98 7.99 49.59 49.60 49.61 49.62 49.63 49.64 49.65 49.66 49.67 49.68 49.69 49.70 49.71 49.72 49.73 49.74 49.74 49.75 49.76 49.77 49.77 49.78 49.79 49.79 49.80 49.81 49.81 49.82 49.82 49.83 49.84 49.84 49.85 49.85 49.86 49 86 (c) Area beyond z 41 40 .39 38. .37 36 35 34 .33 .32 .31 .30 .29 28 .27 26 .26 .25 .24 .23 23 .22 .21 21 .20 .19 .19 .18 .18 17 .16 .16 .15 15 .14 14 (a) Z 3.00 3.01 3.02 3.03 3.04 3.05 3.06 3.07 3.08 3.09 3.10 3.11 3.12 3.13 3.14 3.15 3.16 3.17 3.18 3.19 3.20 3.21 3.22 3.23 3.24 3.25 3.30 3.35 3.40 3.45 3.50 3.60 3.70 3,80 3.90 4.00 (b) Area between Mean and z 49.87 49.87 49.87 49.88 49.88 49.89 49.89 49.89 49.90 49.90 49.90 49.91 49.91 49.91 49.92 49.92 49.92 49.92 49.93 49.93 49.93 49.93 49.94 49.94 49,94 49.94 49.95 49.96 49.97 49.97 49.98 49.98 49.99 49.99 49.995 49.997 Area beyond z .13 .13 .13 .12 .12 .11 11 .11 .10 .10 .10 .09 .09 .09 .08 .08 .08 08 .07 .07 .07 .07 .06 .06 .06 .06 .05 .04 .03 ,03 .02 .02 .01 .01 ,005 .003
Expert Answer:

Related Book For 

Essentials Of Statistics For Business And Economics
ISBN: 9781305081598
7th Edition
Authors: David Anderson, Thomas Williams, Dennis Sweeney, Jeffrey Cam
Posted Date:
Students also viewed these accounting questions
-
answer the question clearly You are building a flight-control system for which a convincing safety case must be made. Would you assign the tasks of safety requirements engineering, test case...
-
QUIZ... Let D be a poset and let f : D D be a monotone function. (i) Give the definition of the least pre-fixed point, fix (f), of f. Show that fix (f) is a fixed point of f. [5 marks] (ii) Show that...
-
The English publisher of a book called Cambridge gave a New York publisher permission to sell that book any place in the world except in England. The New York publisher made several bulk sales of the...
-
The electric field of an electromagnetic wave points in the positive y direction. At the same time, the magnetic field of this wave points in the positive z direction. In what direction is the wave...
-
An airplane lands on the straight runway, originally traveling at 110 ft/s when s = 0. If it is subjected to the decelerations shown, determine the time t' needed to stop the plane and construct the...
-
Bert C. Roberts Jr. was chairman of WorldComs board of directors. Immediately before that, he had been chairman of MCI, which WorldCom acquired on September 14, 1998, in a transaction valued at...
-
Presented below are the financial statements of Rajesh Company. Additional data:1. Dividends declared and paid were $25,000.2. During the year equipment was sold for $8,500 cash. This equipment cost...
-
An aluminum flagpole is 34 m high. By how much does its length increase as the temperature increases by 23 C? (The linear expansion coefficient of aluminum is 23 x 10-6 /C)
-
Suppose there are three types of individuals: high productivity (HP), medium productivity (MP) and low productivity (LP). LP and MP workers amount for a proportion of sizes qL and qM of the entire...
-
If Impossible Foods is trying to grow as a supplier of plant-based meat products, why would it applaud the success of Beyond Meat and other competitors in this market? A. Staying on positive terms...
-
What is the hot-stove rule?
-
If all organizations would hire based solely on the ability to do the job, there would be no need for equal employment opportunity laws. Do you agree or disagree? Defend your position.
-
Describe how positive discipline differs from the traditional disciplinary process.
-
Given that the white male is becoming a minority in the workplace, they should be afforded affirmative action protection. Do you agree or disagree with this? Explain your rationale.
-
Whats in a job? For most workers, jobs entail specific and routine work activities. These work activities generally take place on the employers premise where many different people come together to...
-
Let B = {(1, 0, 1), (0, 1, 1), (1, 1, 0)} and B' = {(1, 0, 0), (0, 1, 0), (0, 0, 1)} be bases for R3, and let 1 -1 2 3 2 A = 2 2 1 1 2 be the matrix for T: R3 R3 relative to B. (b) Use the matrices...
-
Refer to the Conservation Ecology (Dec. 2003) study of the causes of forest fragmentation, presented in Exercise 2.166 (p. 97). Recall that the researchers used advanced high-resolution satellite...
-
In a study entitled How Undergraduate Students Use Credit Cards, it was reported that undergraduate students have a mean credit card balance of $3,173 (Sallie Mae, April 2009). This figure was an...
-
An experiment has four equally likely outcomes: E1, E2, E3, and E4. a. What is the probability that E2 occurs? b. What is the probability that any two of the outcomes occur (e.g., E1 or E3)? c. What...
-
Collinas Italian Caf in Houston, Texas, advertises that carryout orders take about 25 minutes (Collinas website, February 27, 2008). Assume that the time required for a carryout order to be ready for...
-
Volunteer work can improve your skills and enhance your rsum. With a partner, seek volunteer opportunities on your campus or in your city. Make a list of volunteer groups that may need help. Here are...
-
What are six brainstorming questions to consider before starting your proposal?
-
What is the difference between a competitive and noncompetitive proposal?

Study smarter with the SolutionInn App