

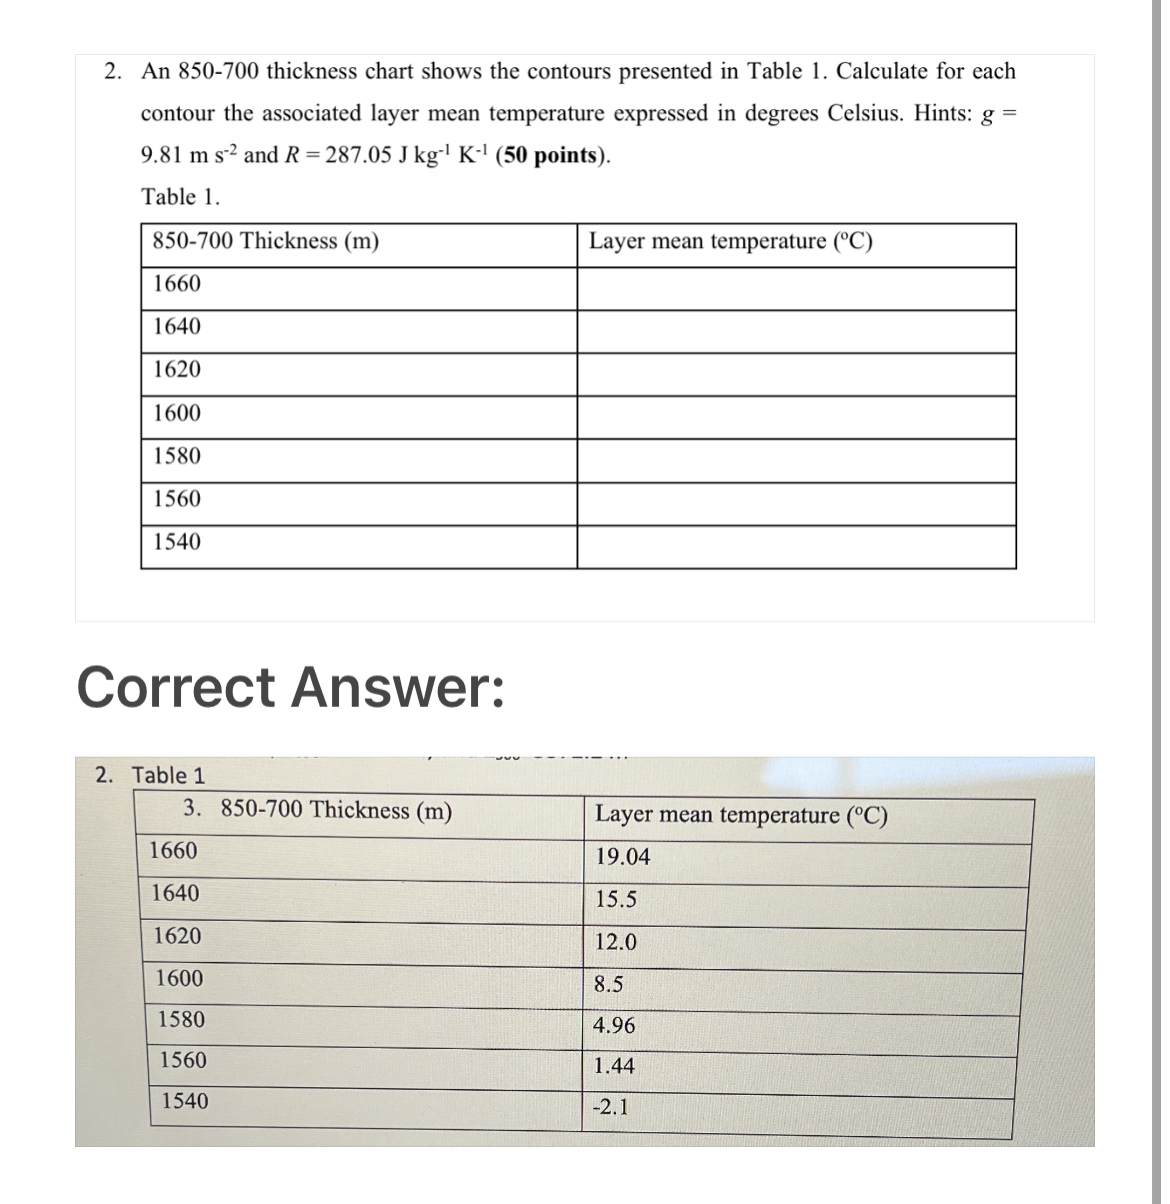
Question: An 8 5 0 - 7 0 0 thickness chart shows the contours presented in Table 1 . Calculate for each contour the associated layer
An thickness chart shows the contours presented in Table Calculate for each contour the associated layer mean temperature expressed in degrees Celsius. Hints: and
Step by Step Solution
There are 3 Steps involved in it
1 Expert Approved Answer
Step: 1 Unlock

Question Has Been Solved by an Expert!
Get step-by-step solutions from verified subject matter experts
Step: 2 Unlock
Step: 3 Unlock