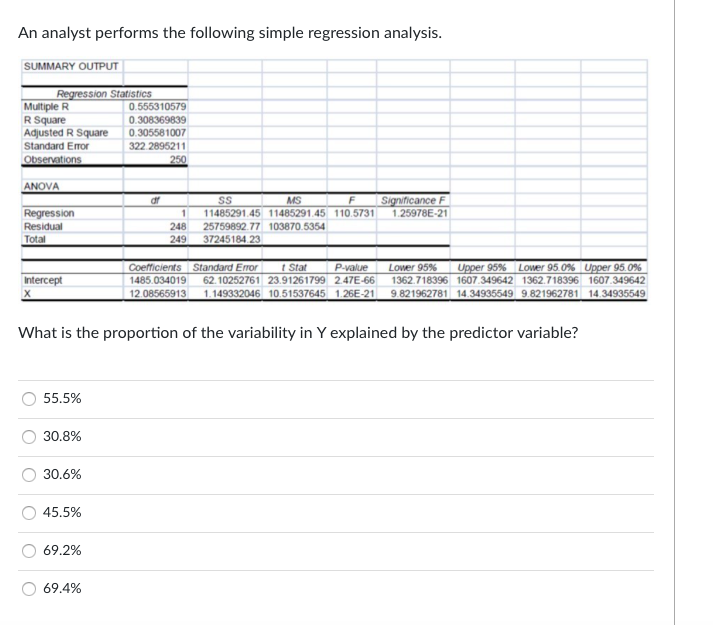
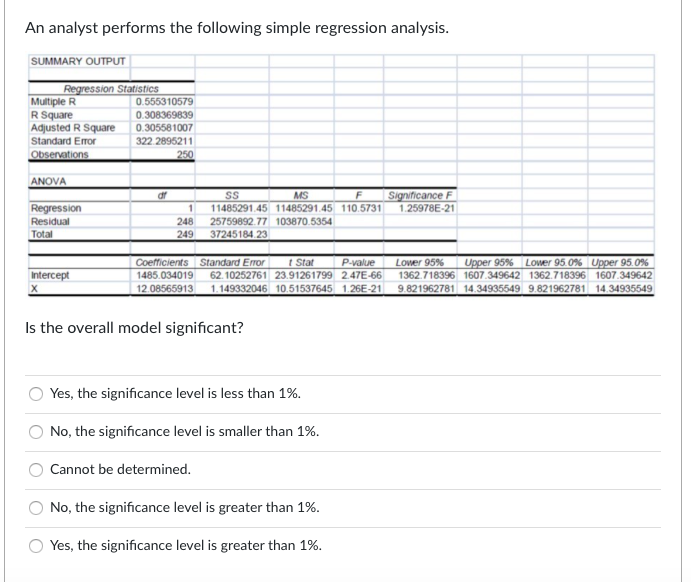
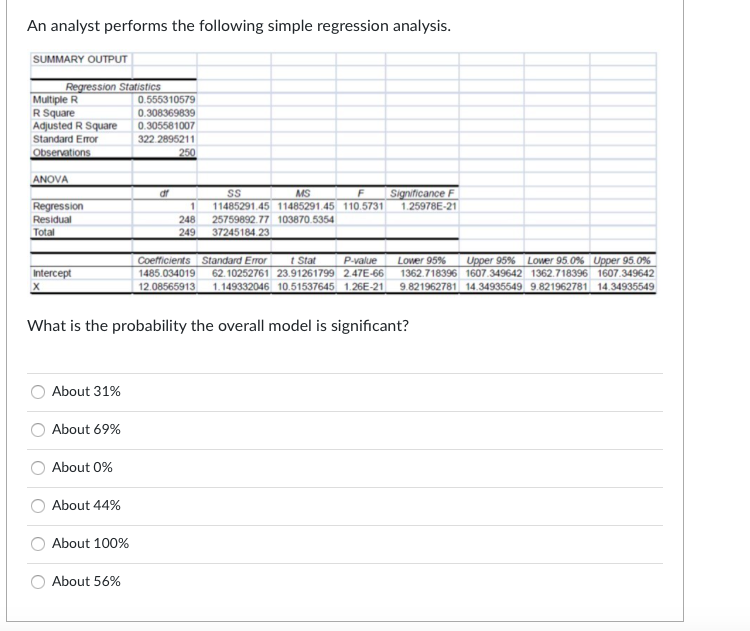
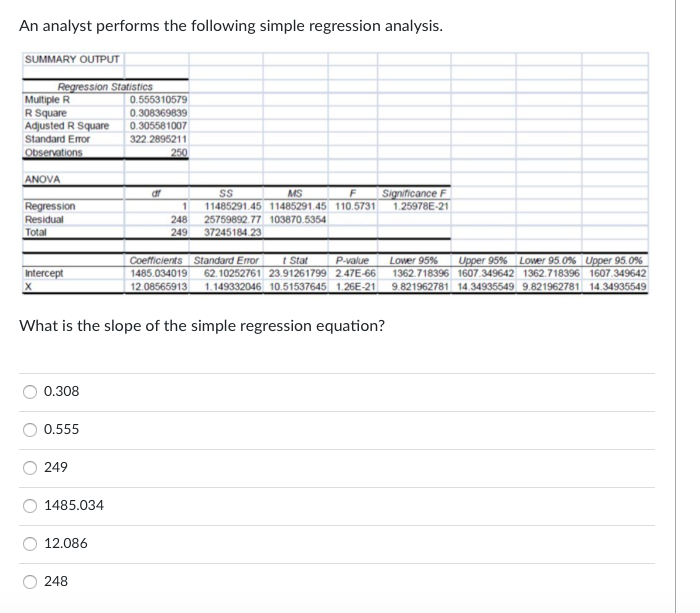
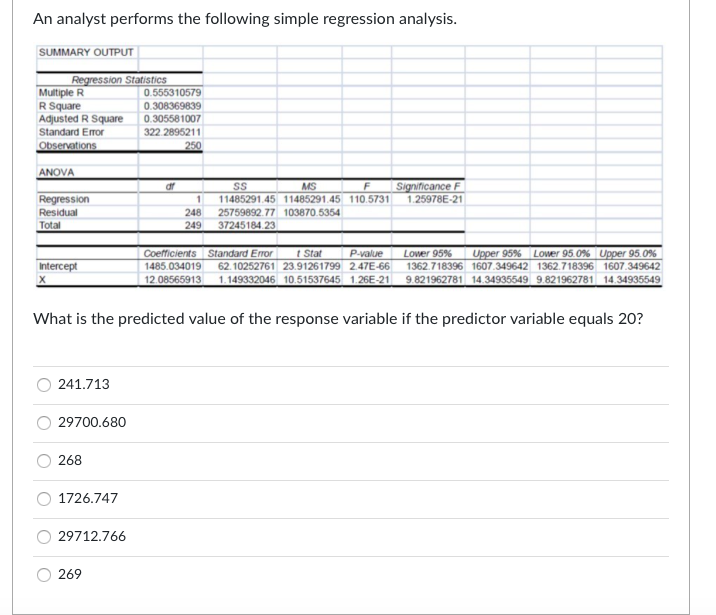
Question: An analyst performs the following simple regression analysis. SUMMARY OUTPUT Regression Statistics Multiple R 0.555310579 R Square 0.308369839 Adjusted R Square 0.305581007 Standard Error 322

An analyst performs the following simpleAn analyst performs the following simpleAn analyst performs the following simpleAn analyst performs the following simpleAn analyst performs the following simple

An analyst performs the following simple regression analysis. SUMMARY OUTPUT Regression Statistics Multiple R 0.555310579 R Square 0.308369839 Adjusted R Square 0.305581007 Standard Error 322 2896211 Observations 250 ANOVA or SS Significance F 1.25978E-21 1 Regression Residual Total MS 11485291.45 11485291.45 110.5731 25759892.77 103870.5354 37245184.23 248 249 Intercept Coefficients Standard Error 1 Star P-value Lower 95% Upper 95% Lower 95.0% Upper 95.0% 1485.034019 62. 10252761 23.91261799 2.47E-66 1362.718396 1607.3496421362.718396 1607.349642 12.08565913 1.149332046 10.51537645 1.26E-21 9.821962781 14.34935549 9.821962781 14.34935549 What is the proportion of the variability in Y explained by the predictor variable? 55.5% 30.8% 30.6% 45.5% 69.2% 69.4% An analyst performs the following simple regression analysis. SUMMARY OUTPUT Regression Statistics Multiple R 0.555310579 R Square 0.308369839 Adjusted R Square 0.305581007 Standard Error 322 2895211 Observations 250 ANOVA or Significance F 1.25978E-21 1 Regression Residual Total SS MS F 11485291.45 11485291,45 110.5731 25759892.77 103870.5354 37245184.23 248 249 Lower 95% Intercept Coefficients Standard Error 1 Stat P-value 1485.034019 62. 10252761 23.91261799 2.47E-66 12.08565913 1.149332046 10.51537645 1.26E-21 Upper 95% Lower 95.0% Upper 95.0% 1362.718396 1607.349642 1362.718396 1607.349642 9.821962781 14.34935549 9.821962781 14.34935549 Is the overall model significant? Yes, the significance level is less than 1%. No, the significance level is smaller than 1%. Cannot be determined. No, the significance level is greater than 1%. Yes, the significance level is greater than 1%. An analyst performs the following simple regression analysis. SUMMARY OUTPUT Regression Statistics Multiple R 0.555310579 R Square 0.308369839 Adjusted R Square 0.305581007 Standard Error 322 2895211 Observations 250 ANOVA or Significance F 1.25978E-21 1 Regression Residual Total SS MS F 11485291.45 11485291.45 110.5731 25759892.77 103870.5354 37245184.23 248 249 Intercept Coefficients Standard Error 1 Stat P-value 1485.034019 62. 10252761 23.91261799 2.47E-66 12.08565913 1.149332046 10.51537645 1.26E-21 Lower 95% Upper 95% Lower 95.0% Upper 95.0% 1362.718396 1607 349642 1362.718396 1607.349642 9.821962781 14.34935549 9.821962781 14.34935549 What is the probability the overall model is significant? About 31% About 69% About 0% About 44% About 100% 0 0 About 56% An analyst performs the following simple regression analysis. SUMMARY OUTPUT Regression Statistics Multiple R 0.555310579 R Square 0.308369839 Adjusted R Square 0.305581007 Standard Error 322 2895211 Observations 250 ANOVA or 1 Regression Residual Total SS MS F Significance F 11485291.45 11485291.45 110.5731 1.25978E-21 25759892.77 103870.5354 37245184.23 248 249 Intercept Coefficients Standard Error 1 Stat P-value 1485.034019 62. 10252761 23.91261799 2.47E-66 12.08565913 1.149332046 10.51537645 1.26E-21 Lower 95% Upper 95% Lower 95.0% Upper 95.0% 1362.718396 1607.349642 1362.718396 1607.349642 9.821962781 14.34935549 9.821962781 14.34935549 What is the slope of the simple regression equation? 0.308 0.555 249 1485.034 12.086 248 An analyst performs the following simple regression analysis. SUMMARY OUTPUT Regression Statistics Multiple R 0.555310579 R Square 0.308369839 Adjusted R Square 0.305581007 Standard Error 322 2895211 Observations 250 ANOVA Significance F 1.25978E-21 1 Regression Residual Total SS MS 11485291.45 11485291,45 110.5731 25759892.77 103870.5354 37245184.23 248 249 Lower 95% Intercept Coefficients Standard Error Stat P-value Upper 95% Lower 95.0% Upper 95.0% 1485.034019 62.10252761 23.91261799 2.47E-66 1362.718396 1607.3496421362.718396 1607.349642 12.08565913 1.149332046 10.51537645 1.26E-21 9.821962781 14.34935549 9.821962781 14.34935549 What is the predicted value of the response variable if the predictor variable equals 20? 241.713 29700.680 268 1726.747 29712.766 269

Step by Step Solution

There are 3 Steps involved in it

1 Expert Approved Answer
Step: 1 Unlock blur-text-image
Question Has Been Solved by an Expert!

Get step-by-step solutions from verified subject matter experts

Step: 2 Unlock
Step: 3 Unlock

Students Have Also Explored These Related General Management Questions!