Question: An analyst performs the following simple regression analysis. SUMMARY OUTPUT Regression Statistics Multiple R R Square Adjusted R Square Standard Error Observations ANOVA Regression Residual

An analyst performs the following simple regression analysis. SUMMARY OUTPUT Regression Statistics Multiple R R Square Adjusted R Square Standard Error Observations ANOVA Regression Residual Total 0.555310579 0.308369839 0.305581007 322.2895211 df 250 MS F SS 11485291.45 11485291.45 110.5731 25759892.77 103870.5354 1 248 249 37245184.23 Coefficients Standard Error t Stat P-value 1485.034019 62.10252761 23.91261799 2.47E-66 12.08565913 1.149332046 10.51537645 1.26E-21 Cannot be determined. Intercept X Is the overall model significant? O Yes, the significance level is less than 1%. O Yes, the significance level is greater than 1%. No, the significance level is greater than 1%. No, the significance level is smaller than 1%. Significance F 1.25978E-21 Lower 95% Upper 95% Lower 95.0% Upper 95.0% 1362.718396 1607.349642 1362.718396 1607.349642 9.821962781 14.34935549 9.821962781 14.34935549
 An analyst performs the following simple regression analysis. SUMMARY OUTPUT Regression
Statistics Multiple R R Square Adjusted R Square Standard Error Observations ANOVA
Regression Residual Total 0.555310579 0.308369839 0.305581007 322.2895211 df 250 MS F SS
11485291.45 11485291.45 110.5731 25759892.77 103870.5354 1 248 249 37245184.23 Coefficients Standard Error
t Stat P-value 1485.034019 62.10252761 23.91261799 2.47E-66 12.08565913 1.149332046 10.51537645 1.26E-21 Cannot

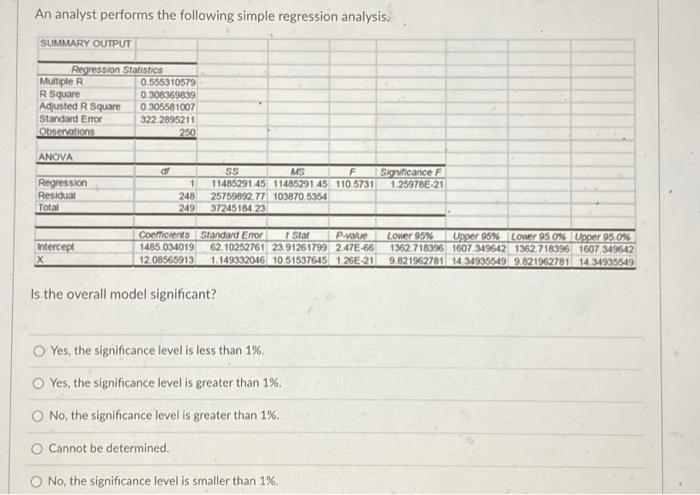
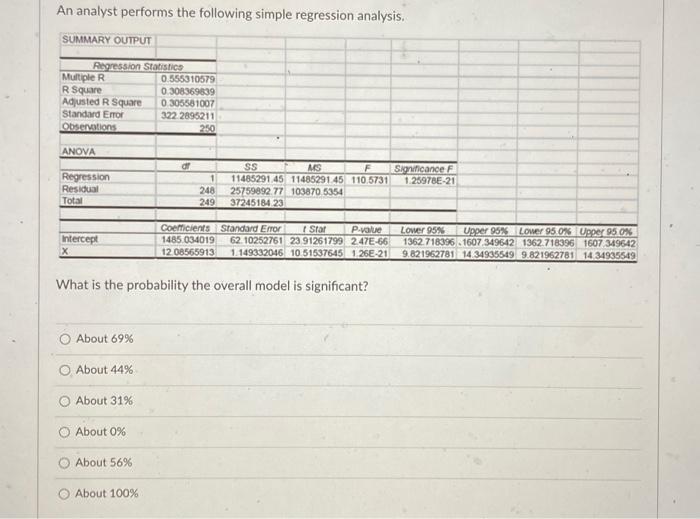
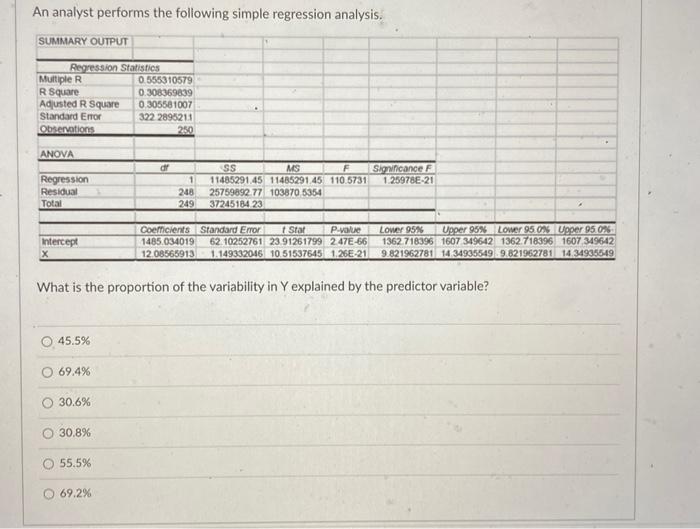
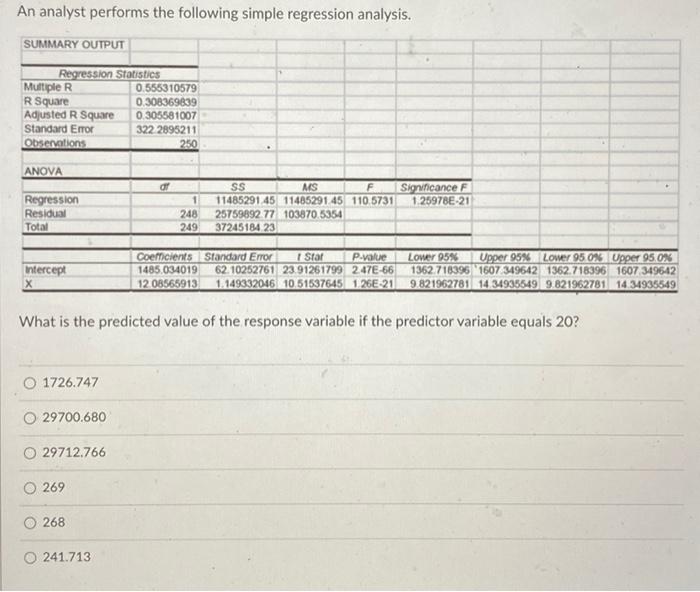
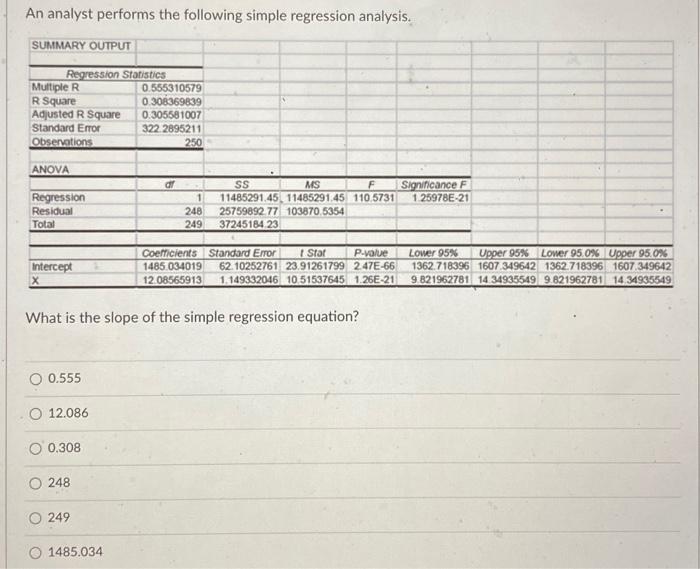
An analyst performs the following simple regression analysis. Is the overall model significant? Yes, the significance level is less than 1%. Yes, the significance level is greater than 1%. No, the significance level is greater than 1%. Cannot be determined. No, the significance level is smaller than 1%. What is the probability the overall model is significant? About 69% About 44% About 31% About 0% About 56% About 100% What is the proportion of the variability in Y explained by the predictor variable? 45.5% 69.4% 30.6% 30.8% 55.5% 69.2% What is the predicted value of the response variable if the predictor variable equals 20 ? 1726.747 29700.680 29712.766 269 268 241.713 What is the slope of the simple regression equation? 0.555 12.086 0.308 248 249 1485.034

Step by Step Solution

There are 3 Steps involved in it

1 Expert Approved Answer
Step: 1 Unlock blur-text-image
Question Has Been Solved by an Expert!

Get step-by-step solutions from verified subject matter experts

Step: 2 Unlock
Step: 3 Unlock

Students Have Also Explored These Related General Management Questions!