

Question: An article in Optical Engineering, Operating curve extraction of a correlator's filter (2004, Vol. 43, pp. 2775-2779) reported on use of an optical correlator to
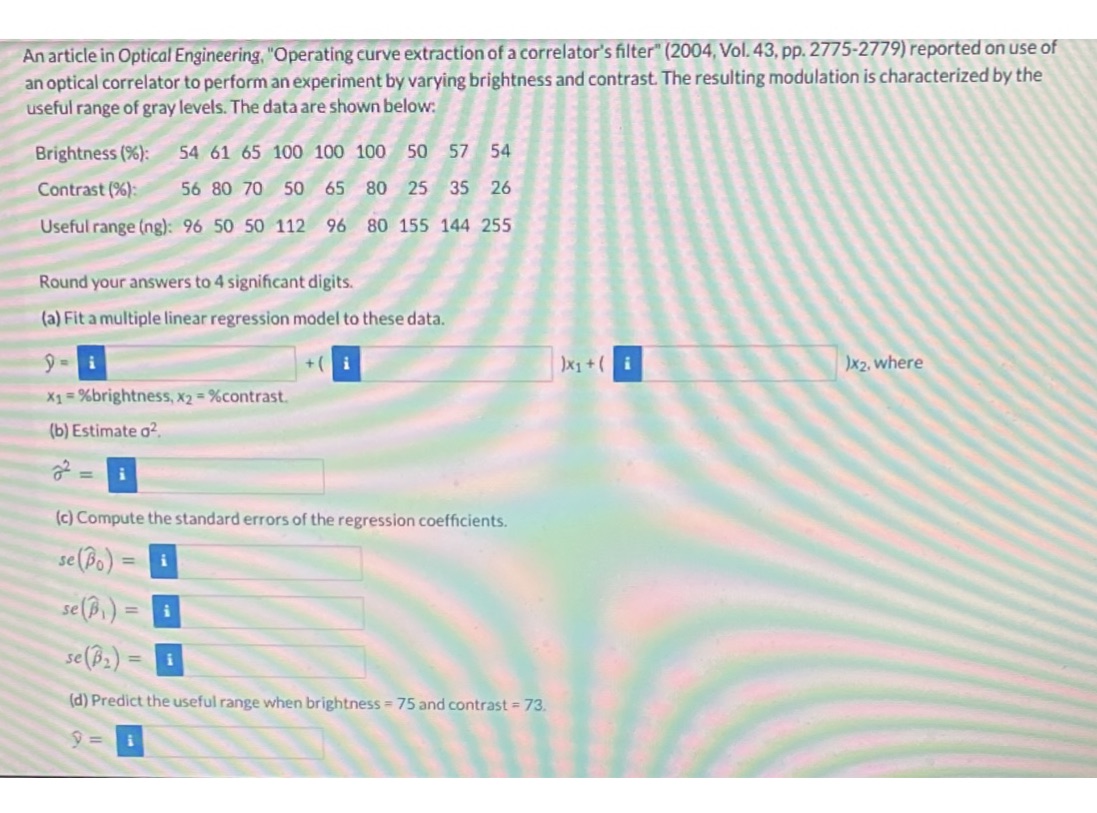
An article in Optical Engineering, "Operating curve extraction of a correlator's filter" (2004, Vol. 43, pp. 2775-2779) reported on use of an optical correlator to perform an experiment by varying brightness and contrast. The resulting modulation is characterized by the useful range of gray levels. The data are shown below: Brightness (%): 54 61 65 100 100 100 50 57 54 Contrast (%): 56 80 70 50 65 80 25 35 26 Useful range (ng): 96 50 50 112 96 80 155 144 255 Round your answers to 4 significant digits. (a) Fit a multiple linear regression model to these data. i 1x1 + i )x2, where X1 =%brightness, x2 = %contrast. (b) Estimate o2. 8 = (c) Compute the standard errors of the regression coefficients. se (Bo ) = 1 se ( B 1 ) = i se ( B 2 ) = 1 (d) Predict the useful range when brightness = 75 and contrast = 73. 9 =
Step by Step Solution
There are 3 Steps involved in it

Get step-by-step solutions from verified subject matter experts