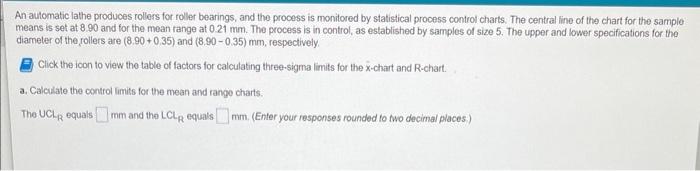
Question: An automatic lathe produces rollers for roller bearings, and the process is monitored by statistical process control charts. The central line of the chart for

An automatic lathe produces rollers for roller
An automatic lathe produces rollers for roller bearings, and the process is monitored by statistical process control charts. The central line of the chart for the sample means is set at 8.90 and for the mean range at 0.21 mm. The process is in control, as established by samples of size 5. The upper and lower specifications for the diameter of the rollers are (8.90 +0.35) and (8.90-0.35) mm, respectively. Click the icon to view the table of factors for calculating three-sigma limits for the x-chart and R-chart. a. Calculate the control limits for the mean and range charts. mm and the LCLg equals mm. (Enter your responses rounded to two decimal places) The UCL equalsmn Aspen Plastics produces plastic bottles to customer order. The quality inspector randomly selects four bottles from the bottle machine and measures the outside diameter of the bottle neck, a critical quality dimension that determines whether the bottle cap will fit properly. The dimensions (in.) from the last six samples are Bottle 2 0.613 0.579 0.581 0.624 0.593 0.592 0.589 0.597 0.583 Click the icon to view the table of factors for calculating three-sigma limits for the x-chart and R-chart. Suppose that the specification for the bottle neck diameter is 0.600 0.050 in, and the population standard deviation is 0.013 in a. What is the process capability index? The Ck is (Enter your response rounded to two decimal places) Sample 2 3 4 5 6 1 0.594 0.602 0.575 0.583 0.611 0.579 3 0.587 0.574 0.574 4 0.585 0.595 0.593 0.597 0.614 0.590 Size of Sample Factor for UCL and LCL for x-chart (A) (n) 23456TBSG 7 9 Factors for calculating three-sigma limits for the x-chart and R-chart Factor for LCL for R-Chart (D3) 10 1.880 1.023 0.729 0.577 0.483 0.419 0.373 0.337 0.308 0 0 OOOO 0 0 0 0.076 0.136 0.184 0.223 Factor for UCL for R-Chart (D) 3.267 2.575 2.282 2.115 2.004 1.924 1.864 1.816 1.777

Step by Step Solution

There are 3 Steps involved in it

1 Expert Approved Answer
Step: 1 Unlock blur-text-image
Question Has Been Solved by an Expert!

Get step-by-step solutions from verified subject matter experts

Step: 2 Unlock
Step: 3 Unlock

Students Have Also Explored These Related General Management Questions!