

Question: a,&b, are correct I only need C An automatic lathe produces rollers for roller bearings, and the process is monitored by statistical process control charts.
a,&b, are correct I only need C 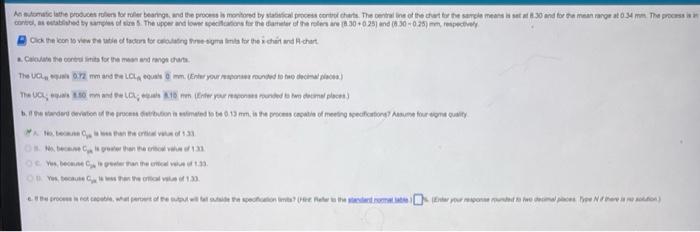
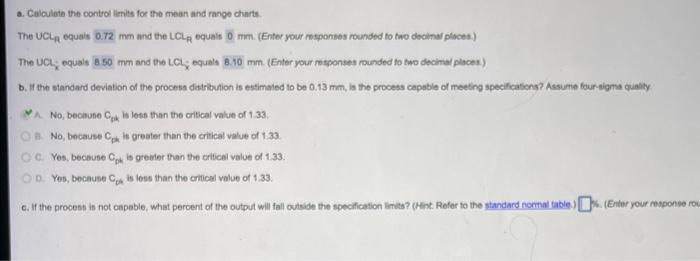
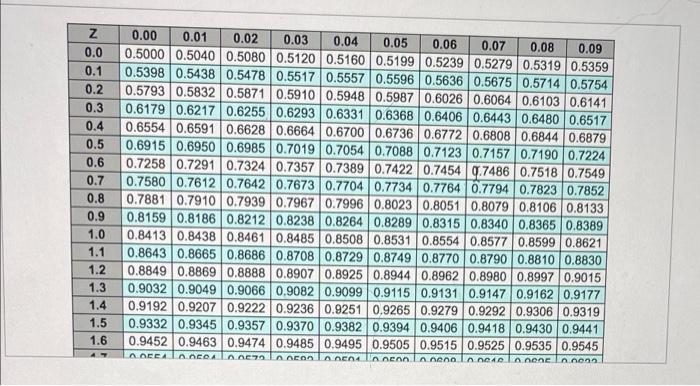
An automatic lathe produces rollers for roller bearings, and the process is monitored by statistical process control charts. The central line of the chart for the sample means is set at 8.30 and for the mean control, as established by samples of size 5. The upper and lower specific are (8.30+0.25) and (8.30-0.25) mm, respectively Click the icon to view the table of factors for calculating three-sigma lints for the chart and chart Calculate the contra limits for the mean and rangs charts The UCL 0.72 mm and the LCL equals 0 mm. (Enter your response rounded to decimal places) The UCL; quals 50 mm and the LC; els 10 men (Enter your responses rounded to two decimal places) b. If the standard deviation of the process distribution is estimated to be 0.13 mm. is the process capable of meeting specifications? Assume four signe quality No es than the critical value of 1.33 greater than the critical value of 131 No because C Yes, because Yes, because peater than the critical value of 1.33. a less than the orical value of 1.33. e the process is not capable, what percent of the subut will the ocation limits? (He y at 0.34 mm. T at 0.34 mm. The process is in a. Calculate the control limits for the mean and range charts. The UCL equals 0.72 mm and the LCL equals 0 mm. (Enter your responses rounded to two decimal places) The UCL; equals 8.50 mm and the LCL, equals 8.10 mm. (Enter your responses rounded to two decimal places) b. If the standard deviation of the process distribution is estimated to be 0.13 mm, is the process capable of meeting specifications? Assume four-sigma quality A No, because Ck is less than the critical value of 1.33. No, because C is greater than the critical value of 1.33 OC. Yes, because Cpk is greater than the critical value of 1.33. OD. Yes, because C is less than the critical value of 1.33. c. If the process is not capable, what percent of the output will fall outside the specification limits? (Hint: Refer to the standard normal table.). (Enter your response rou Z 0.00 0.01 0.02 0.03 0.04 0.05 0.1 0.2 0.3 0.4 0.06 0.07 0.08 0.0 0.5000 0.5040 0.5080 0.5120 0.5160 0.5199 0.5239 0.5279 0.5319 0.5359 0.09 0.5398 0.5438 0.5478 0.5517 0.5557 0.5596 0.5636 0.5675 0.5714 0.5754 0.5793 0.5832 0.5871 0.5910 0.5948 0.5987 0.6026 0.6064 0.6103 0.6141 0.6179 0.6217 0.6255 0.6293 0.6331 0.6368 0.6406 0.6443 0.6480 0.6517 0.6554 0.6591 0.6628 0.6664 0.6700 0.6736 0.6772 0.6808 0.6844 0.6879 0.6915 0.6950 0.6985 0.7019 0.7054 0.7088 0.7123 0.7157 0.7190 0.7224 0.7258 0.7291 0.7324 0.7357 0.7389 0.7422 0.7454 0.7486 0.7518 0.7549 0.7580 0.7612 0.7642 0.7673 0.7704 0.7734 0.7764 0.7794 0.7823 0.7852 0.7881 0.7910 0.7939 0.7967 0.7996 0.8023 0.8051 0.8079 0.8106 0.8133 0.8238 0.8264 0.8289 0.8315 0.8340 0.8365 0.8389 0.8485 0.8508 0.8531 0.8554 0.8577 0.8599 0.8621 0.8749 0.8770 0.8790 0.8810 0.8830 0.8159 0.8186 0.8212 0.8413 0.8438 0.8461 0.8643 0.8665 0.8686 0.8708 0.8729 0.8849 0.8869 0.8888 0.8907 0.8925 0.8944 0.8962 0.8980 0.8997 0.9015 0.9032 0.9049 0.9066 0.9082 0.9099 0.9115 0.9131 0.9147 0.9162 0.9177 0.9192 0.9207 0.9222 0.9236 0.9251 0.9265 0.9279 0.9292 0.9306 0.9319 0.9332 0.9345 0.9357 0.9370 0.9382 0.9394 0.9406 0.9418 0.9430 0.9441 0.9452 0.9463 0.9474 0.9485 0.9495 0.9505 0.9515 0.9525 0.9535 0.9545 ADFEA OOCRA 0.0570 0.0500 0.0501 0050000000 0.0010 0.0005 0.0000 0.5 0.6 0.7 0.8 0.9 1.0 1.1 1.2 1.3 1.4 1.5 1.6 4T
Step by Step Solution
There are 3 Steps involved in it
1 Expert Approved Answer
Step: 1 Unlock

Question Has Been Solved by an Expert!
Get step-by-step solutions from verified subject matter experts
Step: 2 Unlock
Step: 3 Unlock