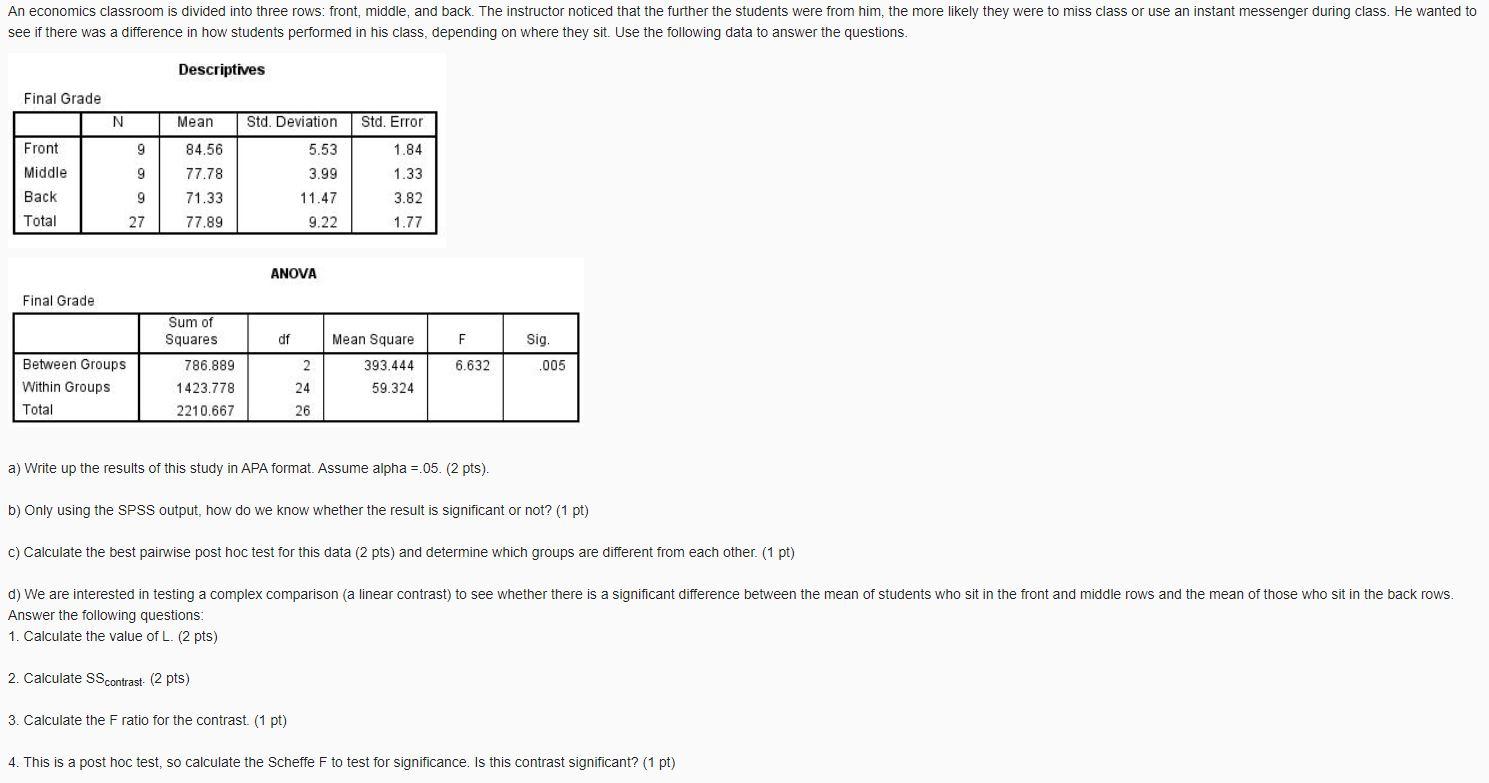
Question: An economics classroom is divided into three rows: front, middle, and back. The instructor noticed that the further the students were from him, the more

An economics classroom is divided into three

An economics classroom is divided into three rows: front, middle, and back. The instructor noticed that the further the students were from him, the more likely they were to miss class or use an instant messenger during class. He wanted to see if there was a difference in how students performed in his class, depending on where they sit. Use the following data to answer the questions. Descriptives Final Grade N Mean Std. Deviation Std. Error Front 9 1.84 9 1.33 Middle Back Total 84.56 77.78 71.33 77.89 5.53 3.99 11.47 9.22 9 3.82 27 1.77 ANOVA Final Grade Sum of Squares df Mean Square Sig. 2 6.632 ,005 Between Groups Within Groups Total 786.889 1423.778 2210.667 393.444 59.324 24 26 a) Write up the results of this study in APA format. Assume alpha=.05. (2 pts). b) Only using the SPSS output, how do we know whether the result is significant or not? (1 pt) c) Calculate the best pairwise post hoc test for this data (2 pts) and determine which groups are different from each other. (1 pt) d) We are interested in testing a complex comparison (a linear contrast) to see whether there is a significant difference between the mean of students who sit in the front and middle rows and the mean of those who sit in the back rows. Answer the following questions: 1. Calculate the value of L. (2 pts) 2. Calculate SS contrast (2 pts) 3. Calculate the F ratio for the contrast. (1 pt) 4. This is a post hoc test, so calculate the Scheffe F to test for significance. Is this contrast significant? (1 pt) An economics classroom is divided into three rows: front, middle, and back. The instructor noticed that the further the students were from him, the more likely they were to miss class or use an instant messenger during class. He wanted to see if there was a difference in how students performed in his class, depending on where they sit. Use the following data to answer the questions. Descriptives Final Grade N Mean Std. Deviation Std. Error Front 9 1.84 9 1.33 Middle Back Total 84.56 77.78 71.33 77.89 5.53 3.99 11.47 9.22 9 3.82 27 1.77 ANOVA Final Grade Sum of Squares df Mean Square Sig. 2 6.632 ,005 Between Groups Within Groups Total 786.889 1423.778 2210.667 393.444 59.324 24 26 a) Write up the results of this study in APA format. Assume alpha=.05. (2 pts). b) Only using the SPSS output, how do we know whether the result is significant or not? (1 pt) c) Calculate the best pairwise post hoc test for this data (2 pts) and determine which groups are different from each other. (1 pt) d) We are interested in testing a complex comparison (a linear contrast) to see whether there is a significant difference between the mean of students who sit in the front and middle rows and the mean of those who sit in the back rows. Answer the following questions: 1. Calculate the value of L. (2 pts) 2. Calculate SS contrast (2 pts) 3. Calculate the F ratio for the contrast. (1 pt) 4. This is a post hoc test, so calculate the Scheffe F to test for significance. Is this contrast significant? (1 pt)

Step by Step Solution

There are 3 Steps involved in it

1 Expert Approved Answer
Step: 1 Unlock blur-text-image
Question Has Been Solved by an Expert!

Get step-by-step solutions from verified subject matter experts

Step: 2 Unlock
Step: 3 Unlock

Students Have Also Explored These Related General Management Questions!