

Question: An electric utility tracks the response time to customer reported outages. The data in Table 8 E . 7 are a random sample of 4
An electric utility tracks the response time to
customer reported outages.
The data in Table E are a random sample
of of the response times in minutes for
one operating division of this utility during a
single month.
The utility wants to achieve a response rate
in under two hours, as response to
emergency outages is an important measure
of customer satisfaction.
a What is the capability of the process with
respect to this objective?
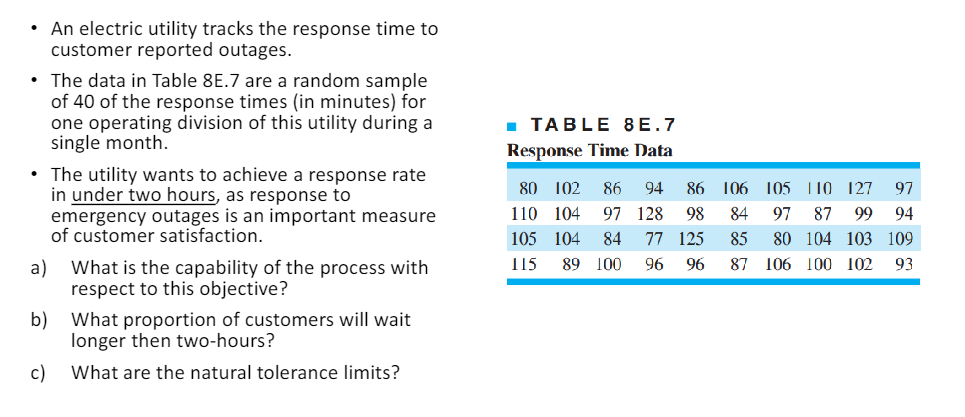
TABLE E
Response Time Data
b What proportion of customers will wait
longer then twohours?
c What are the natural tolerance limits
Step by Step Solution
There are 3 Steps involved in it
1 Expert Approved Answer
Step: 1 Unlock

Question Has Been Solved by an Expert!
Get step-by-step solutions from verified subject matter experts
Step: 2 Unlock
Step: 3 Unlock