

Question: engineering statistics the excel sheet is not necessary, can you please show me how to solve each step with the formulas? thank you!! Application 1
engineering statistics
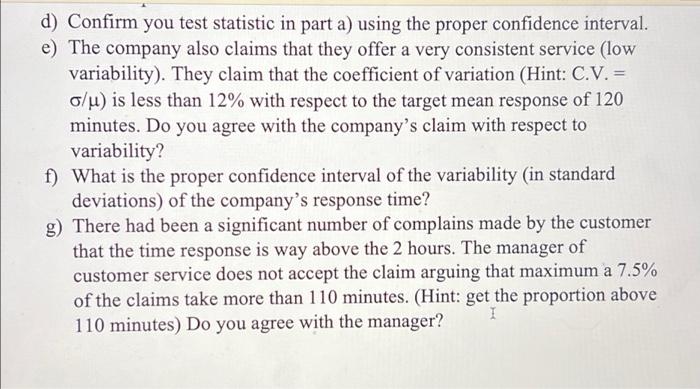
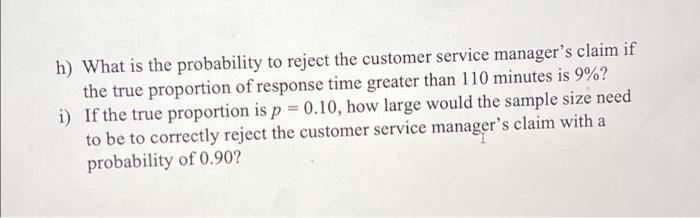
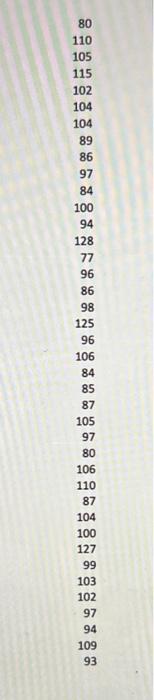
Application 1 Clearly answer each question, formulating the hypothesis (null and alternative), rejection criteria, formulas, and interpreting the results. Proving just the Minitab output would not give you any credit. You can use Excel or Minitab but still need to answer step by step each question. Clearly label each question. 1. An electric supplier tracks the response time to customers reported outages. The Table in Excel file Application 1 Prl are a random sample of 40 of the response time (in minutes) for one operating division of this utility during a single month. a) The utility company claims that their response to emergency outages is under two hours. Using a confidence level of 95% and the proper test statistic, determine if the utility company on average does respond within the two hours. b) What is the minimum level of significance that will lead you to reject the null hypothesis? c) What would be the probability to accept the company's claim if the true mean response is 130 minutes? FOGWE d) Confirm you test statistic in part a) using the proper confidence interval. e) The company also claims that they offer a very consistent service (low variability). They claim that the coefficient of variation (Hint: C.V. = c/u) is less than 12% with respect to the target mean response of 120 minutes. Do you agree with the company's claim with respect to variability? f) What is the proper confidence interval of the variability (in standard deviations) of the company's response time? g) There had been a significant number of complains made by the customer that the time response is way above the 2 hours. The manager of customer service does not accept the claim arguing that maximum a 7.5% of the claims take more than 110 minutes. (Hint: get the proportion above 110 minutes) Do you agree with the manager? h) What is the probability to reject the customer service manager's claim if the true proportion of response time greater than 110 minutes is 9%? i) If the true proportion is p = 0.10, how large would the sample size need to be to correctly reject the customer service manager's claim with a probability of 0.90? 80 110 105 115 102 104 104 89 86 97 84 100 94 128 77 96 86 98 125 96 106 84 85 87 105 97 80 106 110 87 104 100 127 99 103 102 97 94 109 93 the excel sheet is not necessary, can you please show me how to solve each step with the formulas? thank you!! 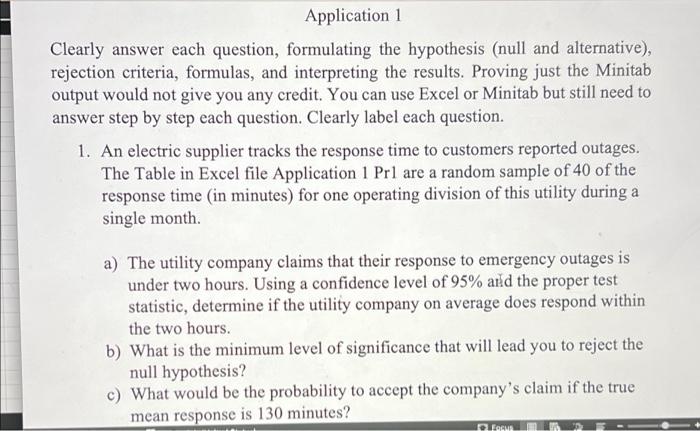
Step by Step Solution
There are 3 Steps involved in it
1 Expert Approved Answer
Step: 1 Unlock

Question Has Been Solved by an Expert!
Get step-by-step solutions from verified subject matter experts
Step: 2 Unlock
Step: 3 Unlock