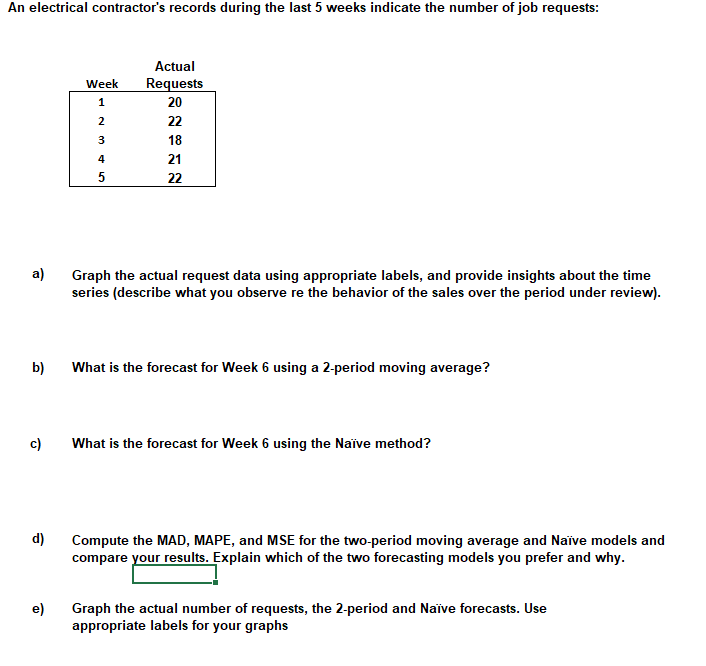
Question: An electrical contractor's records during the last 5 weeks indicate the number of job requests: Actual Requests Week a) Graph the actual request data using

An electrical contractor's records during the

An electrical contractor's records during the last 5 weeks indicate the number of job requests: Actual Requests Week a) Graph the actual request data using appropriate labels, and provide insights about the time series (describe what you observe re the behavior of the sales over the period under review). b) What is the forecast for Week 6 using a 2-period moving average? c) What is the forecast for Week 6 using the Naive method? d) Compute the MAD, MAPE, and MSE for the two-period moving average and Naive models and compare your results. Explain which of the two forecasting models you prefer and why. Graph the actual number of requests, the 2-period and Naive forecasts. Use appropriate labels for your graphs

Step by Step Solution

There are 3 Steps involved in it

1 Expert Approved Answer
Step: 1 Unlock blur-text-image
Question Has Been Solved by an Expert!

Get step-by-step solutions from verified subject matter experts

Step: 2 Unlock
Step: 3 Unlock

Students Have Also Explored These Related General Management Questions!